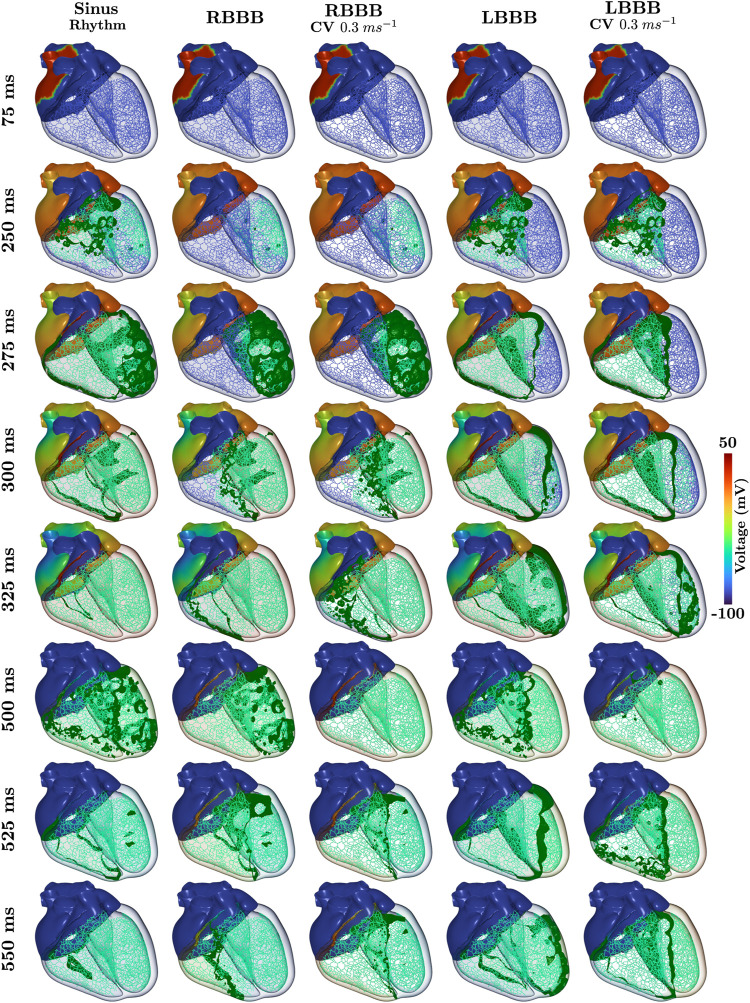
FIGURE 4.
Time-course of the transmembrane voltage within the heart for sinus rhythm and BBBs with both normal and halfed CV in the respective affected ventricle. Green isosurfaces within the ventricles correspond to a membrane voltage of −40 mV and the color map corresponds to the atrial trans-membrane voltages.

