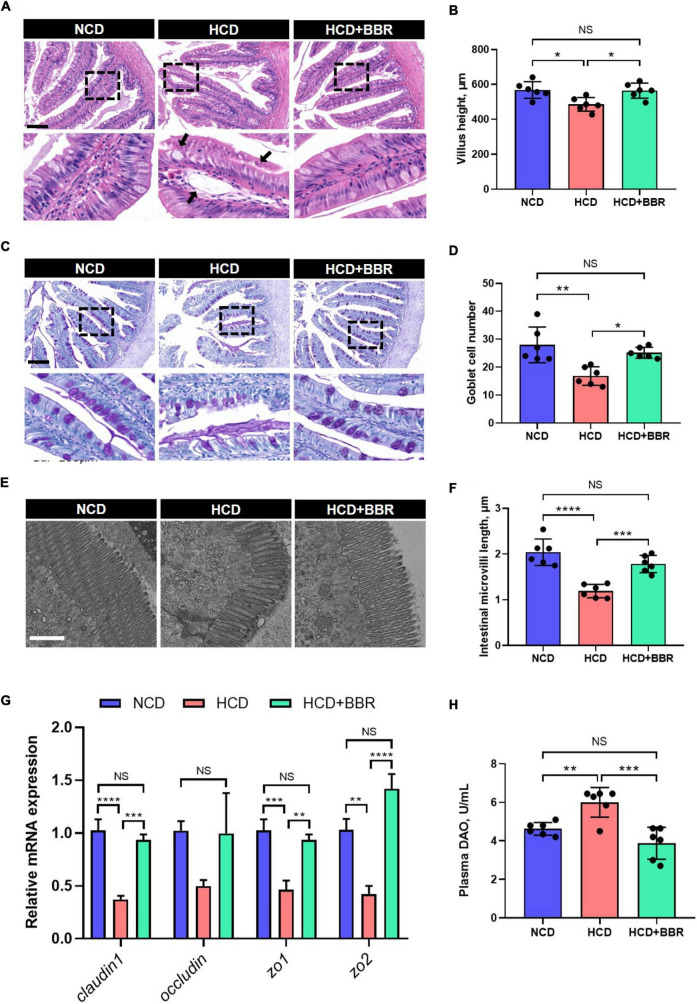
FIGURE 2.
Dietary BBR improved the HCD-induced morphology and barrier damages in the intestine of largemouth bass. (A) H&E staining images of intestinal sections (arrows indicate damages, bar = 100 μm). (B) Villus height of intestine. (C) PAS staining images of intestinal sections (bar = 100 μm). (D) Goblet cell number in villus. (E) Transmission electron microscope images of intestinal microvilli (bar = 1 μm). (F) Intestinal microvilli length. (G) Expression level of tight junction-related genes. (H) Plasma DAO level. Data are represented as means ± SEM (n = 6). *, **, ***, ****Different from each other: *P < 0.05, **P < 0.01, ***P < 0.001, ****P < 0.0001, NS means no significant difference (One-way ANOVA, Duncan’s post hoc test).

