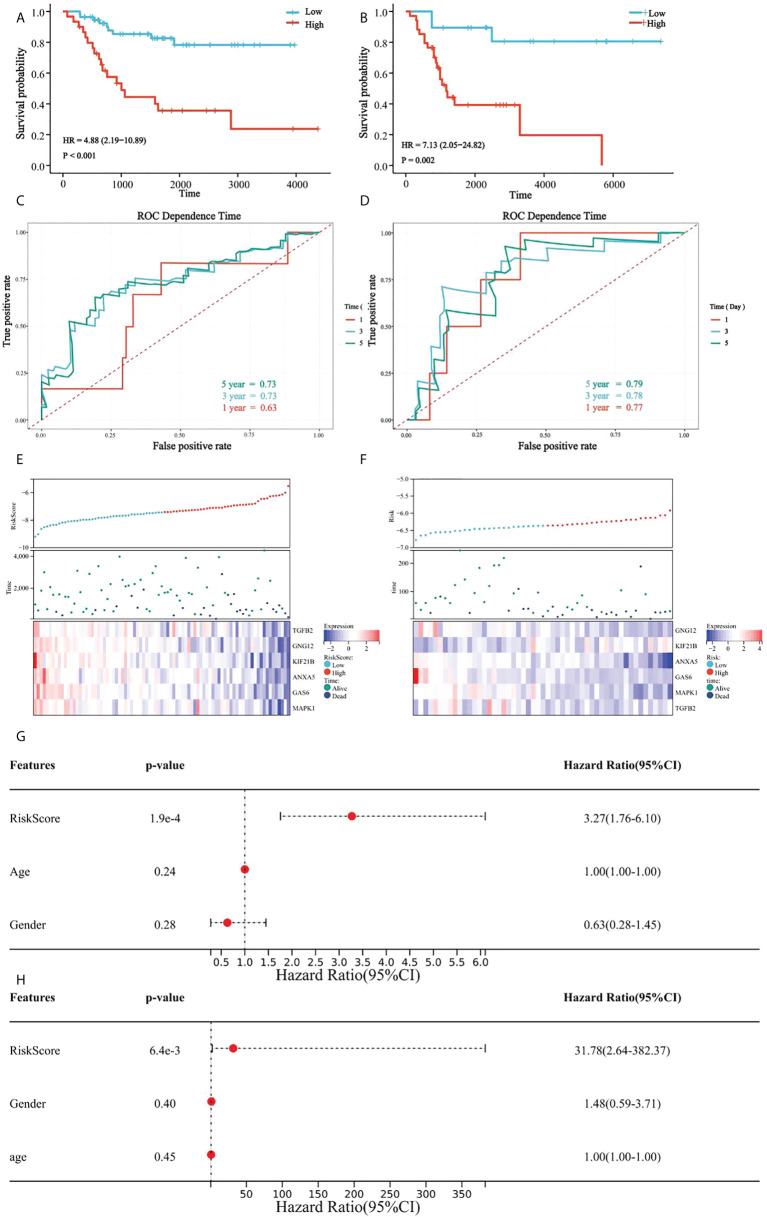
Figure 7.
Verification of platelet score characteristics. (A) Survival difference between high-rating and low-rating groups in the TCGA cohort; (B) Survival difference between high-rating and low-rating groups in the GSE21257 cohort; (C) Time-dependent ROC analysis of TCGA cohort; (D) Time-dependent ROC analysis of the GSE21257 cohort; (E) Candidate gene expression and survival heatmap in TCGA cohort; (F) Candidate genes expression and survival heatmap in the GSE21257 cohort; (G) Forest diagram of multivariate results of platelet characteristic score model and clinical factors in TCGA cohort; and (H) Forest diagram of multivariate results of platelet characteristic score model and clinical factors in the GSE21257 cohort.

