Figure 4.

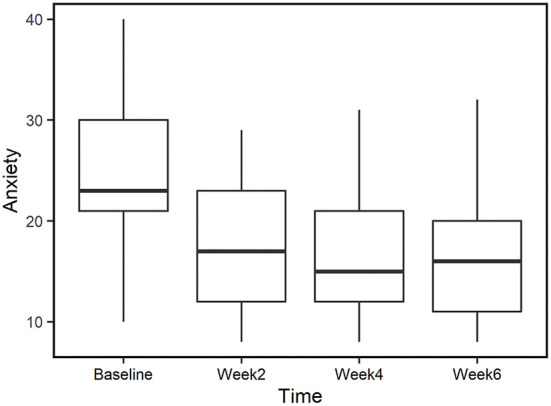
Anxiety scores for those who completed all time points (n = 29). Median values are represented by horizontal black lines in the box plot.

Anxiety scores for those who completed all time points (n = 29). Median values are represented by horizontal black lines in the box plot.