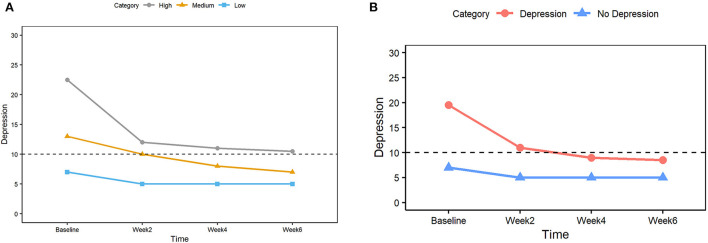
Figure 5.
(A) Median depression scores for three groups (High, Medium, and Low) based on the tertiles at the baseline. The dashed horizontal line indicates the clinically significant cutoff (score 10 or higher considered to be depression). (B) Median depression scores for two groups (Depression, No depression) based on the clinically significant cutoff of 10 at the baseline. The dashed horizontal line indicates the clinically significant cutoff (score 10 or higher considered to be depression).

