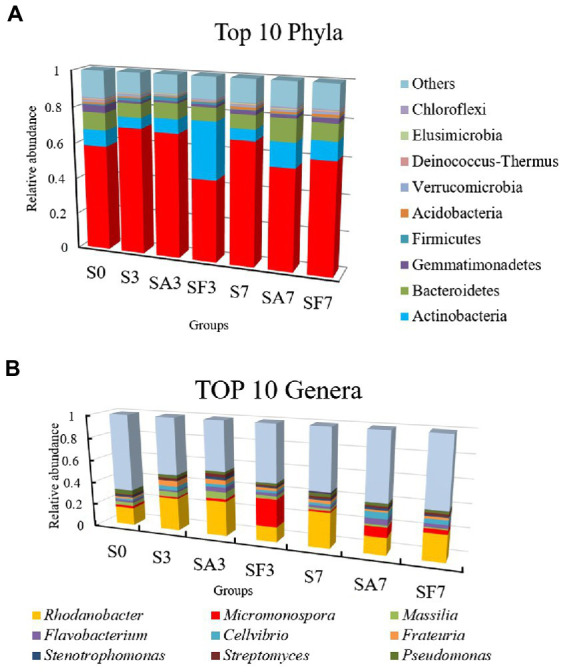
Figure 3.

Assembly of core rhizosphere microbial communities. (A) Community bar-plot analysis of the relative abundance of rhizosphere microbial communities in the different soil groups at the phylum level. (B) Community bar-plot analysis of the relative abundance of rhizosphere microbial communities in the different soil groups at the genus level. S0, Mock-inoculation control (before treatment); S3, mock-inoculation control, 3 dpi; S7, mock-inoculation control, 7 dpi; SA3, SA + FON treatment, 3 dpi; SA7, SA + FON treatment, 7 dpi; SF3, FON treatment, 3 dpi; SF7, FON treatment, 7 dpi. FON, Fusarium oxysporum f. sp. niveum; SA, salicylic acid; dpi, days post inoculation. Three biological replicates per sample were analyzed. Data are expressed as mean ± SE (n = 3).
