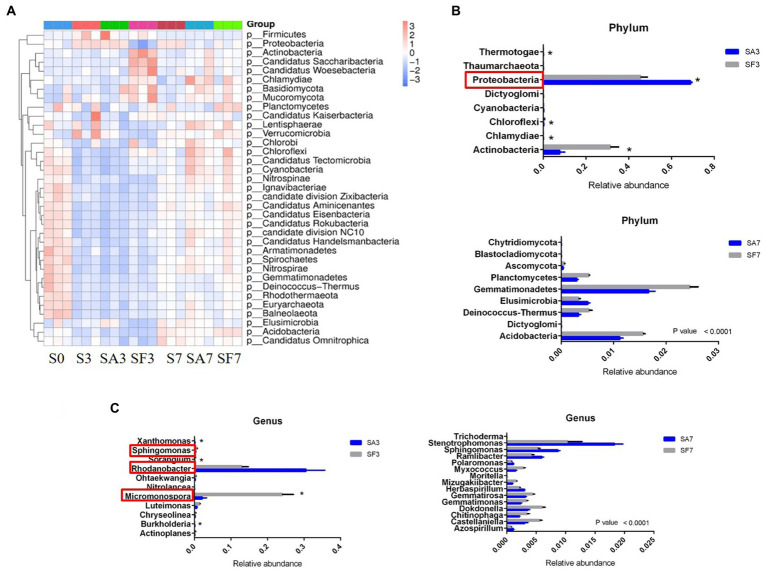
Figure 4.
Dynamic changes in the significantly abundant rhizosphere microbial communities. (A) Heatmap of the dynamic changes in different phyla among the various soil groups. (B) Bar plots showing the significant differences in relative abundance of the main phyla. (C) Bar plots showing the significant differences in relative abundance of the main genera. Three biological replicates per samples were analyzed. Data are expressed as mean ± SE (n = 3). Multiple t-tests (*p ≤ 0.01). S0, Mock-inoculation control, before treatment; S3, mock-inoculation control, 3 dpi; S7, mock-inoculation control, 7 dpi; SA3, SA + FON treatment, 3 dpi; SA7, SA + FON treatment, 7 dpi; SF3, FON treatment, 3 dpi; SF7, FON treatment, 7 dpi; FON, Fusarium oxysporum f. sp. niveum; SA, salicylic acid; dpi, days post-inoculation.

