Figure 5.
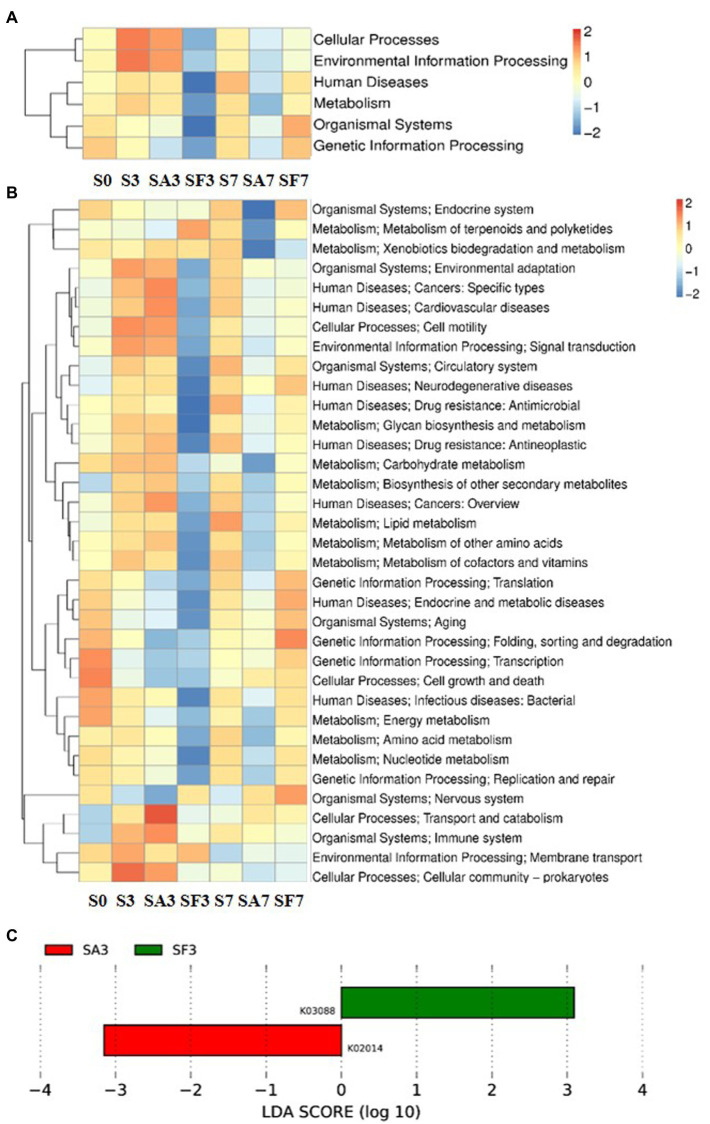
Functional diversity of the microbiomes among different soil samples based on KEGG pathways analysis (A) Heatmap of enrichment differences in six major metabolic pathways on level 1 among the samples. (B) Heatmap of enrichment differences in metabolic pathways on level 2 among the samples. The X-axis represents the sample group names; the Y-axis represents the KEGG metabolic pathway annotation information. (C) Distribution of linear discriminant analysis (LDA) scores between the SA3 and SF3 KEGG ortholog groups. S0, Mock-inoculation control, before treatment; S3, mock-inoculation control, 3 dpi; S7, mock-inoculation control, 7 dpi; SA3, SA + FON treatment, 3 dpi; SA7, SA + FON treatment, 7 dpi; SF3, FON treatment, 3 dpi; SF7, FON treatment, 7 dpi; FON, Fusarium oxysporum f. sp. niveum; SA, salicylic acid; dpi, days post-inoculation.

