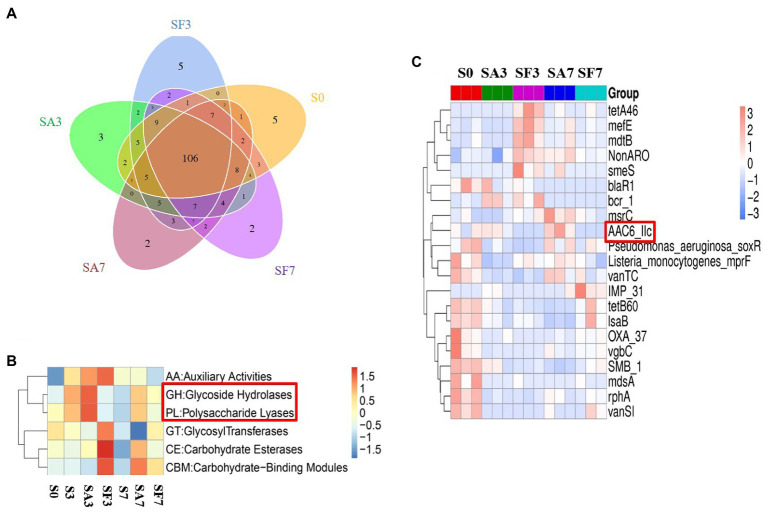
Figure 7.
Differential abundance of functional resistance genes among different soil samples (A) Venn diagram showing the distribution of functional resistance genes among the five selected sample groups. (B) Heatmap of the differences in relative abundance of six CAZy classes among the samples. (C) Heatmap of the differences in relative abundance of the antibiotic resistance ontology (ARO) cluster among the samples. S0, Mock-inoculation control, before treatment; S3, mock-inoculation control, 3 dpi; S7, mock-inoculation control, 7 dpi; SA3, SA + FON treatment, 3 dpi; SA7, SA + FON treatment, 7 dpi; SF3, FON treatment, 3 dpi; SF7, FON treatment, 7 dpi. FON, Fusarium oxysporum f. sp. niveum; SA, salicylic acid; dpi, days post-inoculation.

