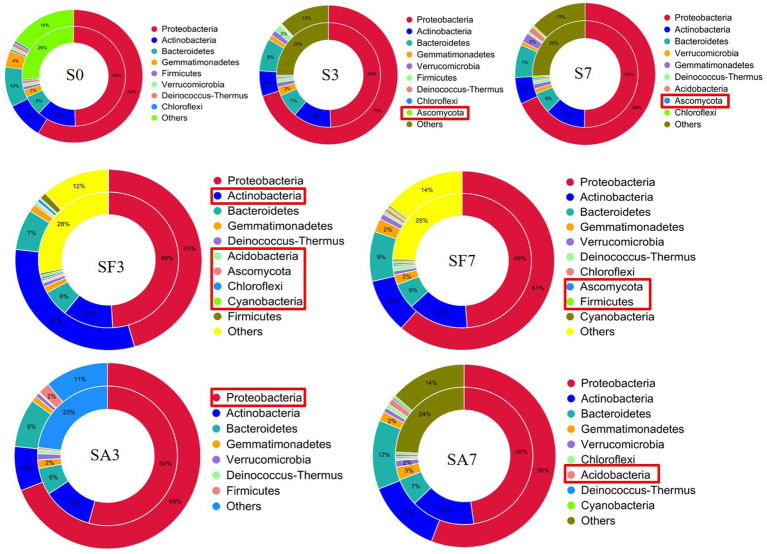
Figure 8.
Comparison of the relationship between resistance genes and main phyla in the different soil samples S0, Mock-inoculation control, before treatment; S3, mock-inoculation control, 3 dpi; S7, mock-inoculation control, 7 dpi; SA3, SA + FON treatment, 3 dpi; SA7, SA + FON treatment, 7 dpi; SF3: FON treatment, 3 dpi; SF7, FON treatment, 7 dpi. The inner circle is the phylum distribution for the antibiotic resistance ontology (ARO) cluster, and the outer circle is the phylum distribution for all sample genes in the group. FON, Fusarium oxysporum f. sp. niveum; SA, salicylic acid; dpi, days post inoculation.

