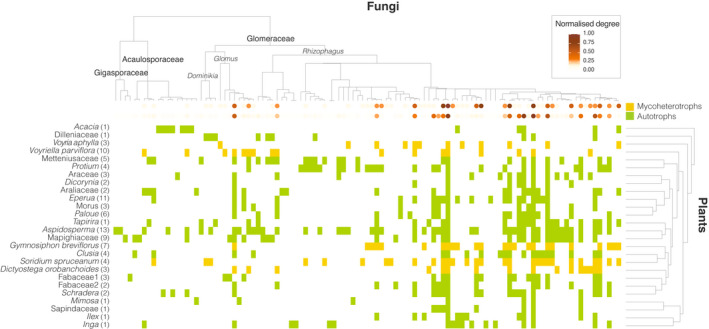
Fig. 4.

Plant–fungi interactions of autotrophic (green) and mycoheterotrophic (yellow) plants using a matrix rarefied to a depth of 844 reads. Phylogenetic relationships between the fungi are shown at the top. Plant species are listed on the left with the number of individual samples in between parentheses; hierarchy clustered dendrogram based on the Bray–Curtis distance of their fungal communities is shown on the right. The intensity of the orange dots on the tips of the fungal phylogeny depicts the normalised degree (representing their interaction strength) of each fungus in each of the plant–fungi networks (i.e. in the mycoheterotrophic plants–fungi and autotrophic plants–fungi networks). Values between parentheses represent the number of individual samples per species.
