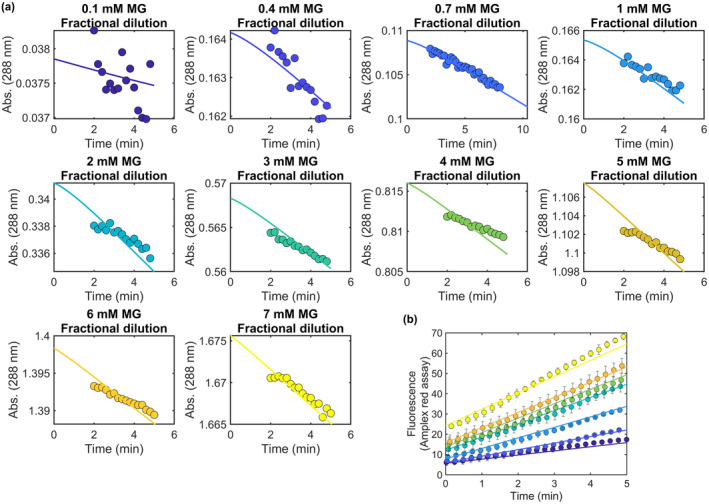
FIGURE 4.

Kinetic simulation of DJ‐1 deglycase and glyoxalase activities. (a) Experimental progress curves for loss of MG‐NAC hemithioacetal signal at 288 nm (colored dots) are superimposed with kinetic modeling results (solid lines) for various concentrations of total MG concentration at initial dilution. The simulation requires only a DJ‐1 glyoxalase activity to produce good fits to the apparent deglycase activity. (b) Experimentally measured DJ‐1 glyoxalase activity against various concentrations of MG (colored dots) is well‐modeled by the kinetic simulation (solid lines) whose rate constants also explain the apparent deglycase activities in (a).
