FIGURE 5.

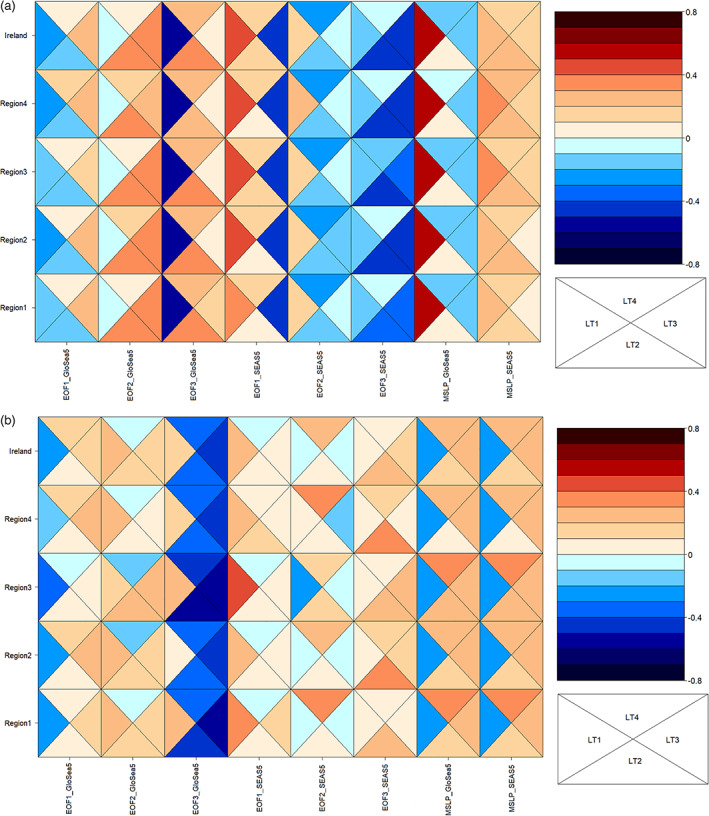
Correlations between dynamical model MSLP EOF indices and precipitation by lead time (LT) and region in (a) winter and (b) summer [Colour figure can be viewed at wileyonlinelibrary.com]

Correlations between dynamical model MSLP EOF indices and precipitation by lead time (LT) and region in (a) winter and (b) summer [Colour figure can be viewed at wileyonlinelibrary.com]