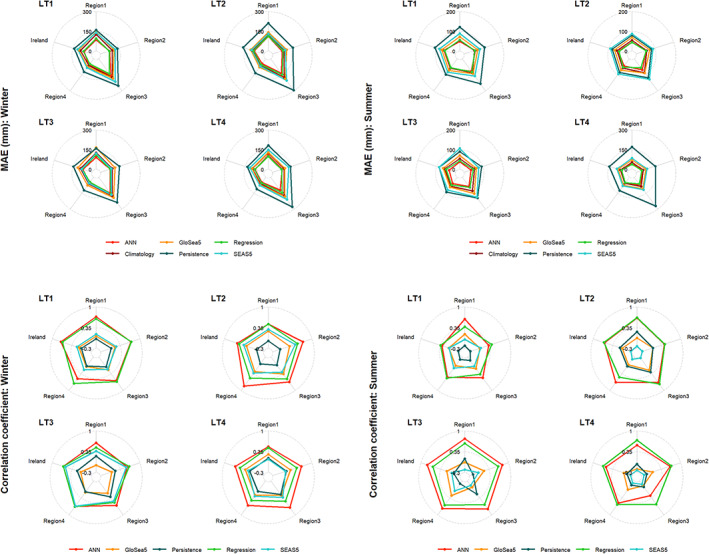
FIGURE 8.

Performance of the methods as evaluated using MAE, and correlation coefficient for different lead‐times (LT) and regions in winter (left column) and summer (right column) [Colour figure can be viewed at wileyonlinelibrary.com]

Performance of the methods as evaluated using MAE, and correlation coefficient for different lead‐times (LT) and regions in winter (left column) and summer (right column) [Colour figure can be viewed at wileyonlinelibrary.com]