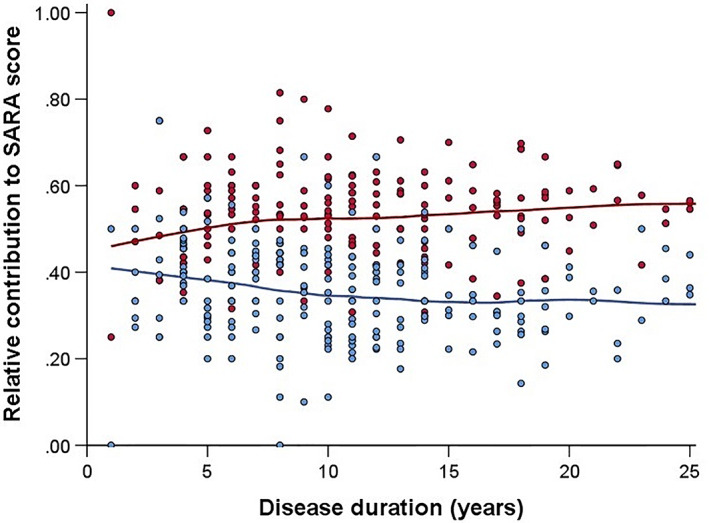
FIG. 1.

Relative contributions of axial and appendicular SARA subscores at baseline versus disease duration in SCA3 patients, fitted with LOESS regression. Red dots and the red line represent axial subscores, whereas blue dots and the blue line represent appendicular subscores. [Color figure can be viewed at wileyonlinelibrary.com]
