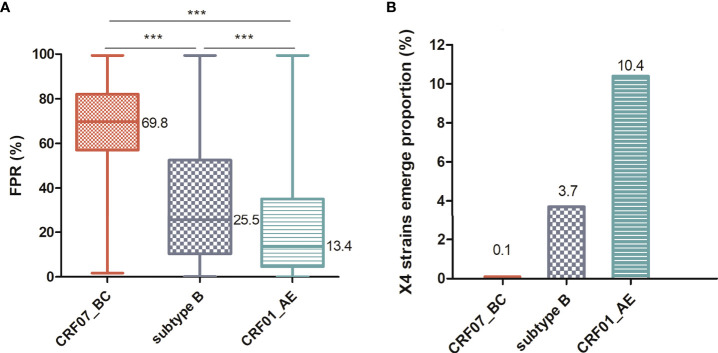
Figure 1.
Comparison of the prevalence of X4-tropic strains among different HIV-1 subtypes. (A) Comparison of FPR among CRF07_BC (n = 1,123), CRF01_AE (n = 1,235), and subtype B (n = 134) infections. (B) X4-tropic strains show a proportion (set FPR<2%) in different HIV-1 subtypes. The middle bars indicate median, box indicates interquartile range, and whiskers indicate minimum and maximum. The statistical difference in FPR was calculated using the non-parametric Kruskal–Wallis test. The percentage of FPR below 2% was compared using the Pearson chi-square (χ2) test. *** means P < 0.0001.

