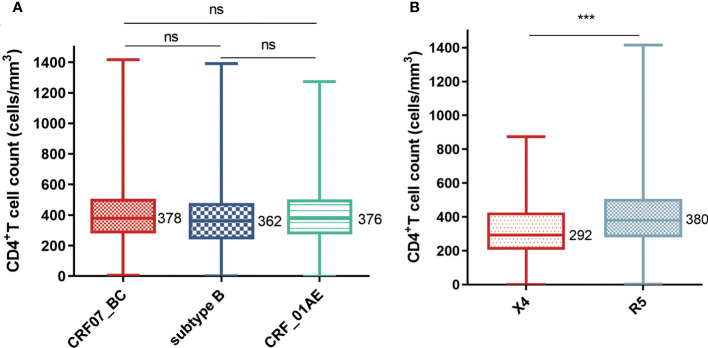
Figure 2.
Comparison of the CD4+T cell counts (A) Comparison of CD4+T cell counts among different HIV-1 subtypes (the number of samples of CRF07_BC, subtype B, and CRF01_AE are 1,123, 134, and 1,235). (B) Comparison of CD4+T cell counts between X4-tropic (n = 135) and R5-tropic (n = 2,357) strain-infected individuals. The middle bars indicate median, box indicates interquartile range, and whiskers indicate minimum and maximum. The statistical difference in CD4+T cell count was calculated using the non-parametric Kruskal–Wallis test. *** means P < 0.0001. ns, no significance.

