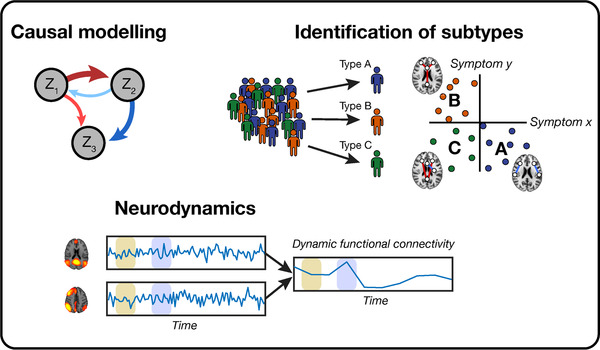
FIGURE 3.

An overview of recent developments in analysis methods of functional MRI studies used in major depressive disorder (MDD). Top left: causal modeling is a method that is directional and compares the functional connectivity (FC) between n regions or networks (Zn ). Below: neurodynamical analyses measure the difference in FC over time. On the bottom left, the FC is calculated in the beige and blue window between two different networks, after which the dynamic FC over time is shown on the bottom right. Top right: from MDD samples, multiple biotypes can be identified (here A, B, and C) in which different connectivity patterns associated with specific symptoms.
