
FIGURE 2.
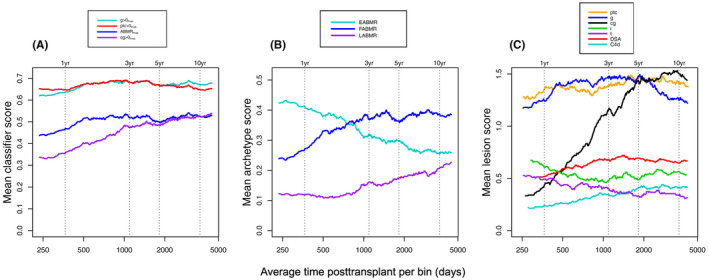
Moving averages showing relationships between ABMR‐associated molecular and histologic features and time posttransplant in 464 archetype‐assigned mABMR biopsies. (A) Molecular classifier scores over time, (B) ABMR‐associated archetypes over time, and (C) ABMR‐associated histology features, DSA, and C4d over time. Moving averages (window size 150) were plotted by first sorting the biopsies by their time posttransplant, then plotting the mean of biopsies 1–150 y‐variable values against the mean of the biopsies 1–150 days posttransplant. The window is then slid to biopsies 2–151, 3–152, etc. with the process repeated. Consecutive window “bins” are created, and the moving averages calculated for each bin