
FIGURE 4.
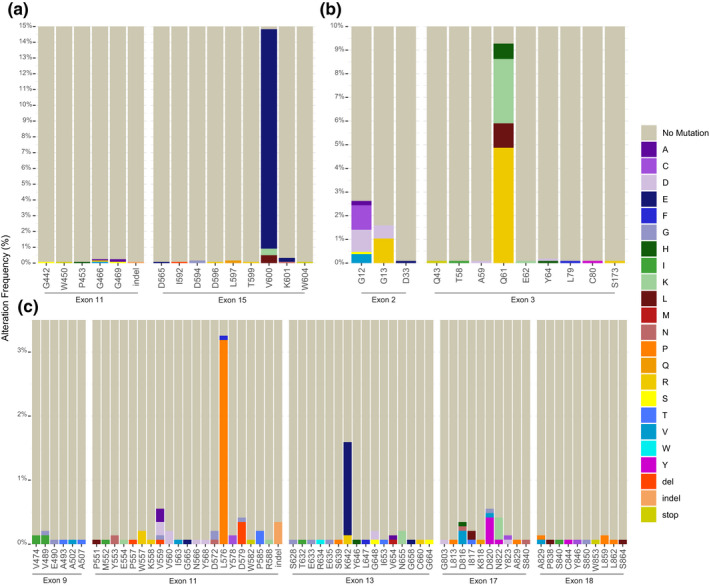
Targeted hot spot analysis. To identify recurrent mutations in well‐known melanoma genes BRAF, NRAS, and KIT, mutation reports from targeted sequencing studies were hand‐collated and the frequency of alterations was summarized by exon/codon. (a) Summary of mutations identified in BRAF exon 11 (n = 944) and exon 15 (n = 1207) mutations. (b) Summary of NRAS mutations in exon 2 (n = 1065) and 3 (n = 1067). (c). Summary of KIT mutations in exons 9 (n = 1059), 11 (n = 1443), 13 (n = 1443), 17 (n = 1270), and 18 (n = 1035). KIT single codon deletions indicated as “del.” Larger insertions–deletions are indicated as “indel.” Codon position is indicated along the x‐axis of each panel. Percentages expressed represent the frequency of alterations by exon. Colors are indicative of amino acid changes identified