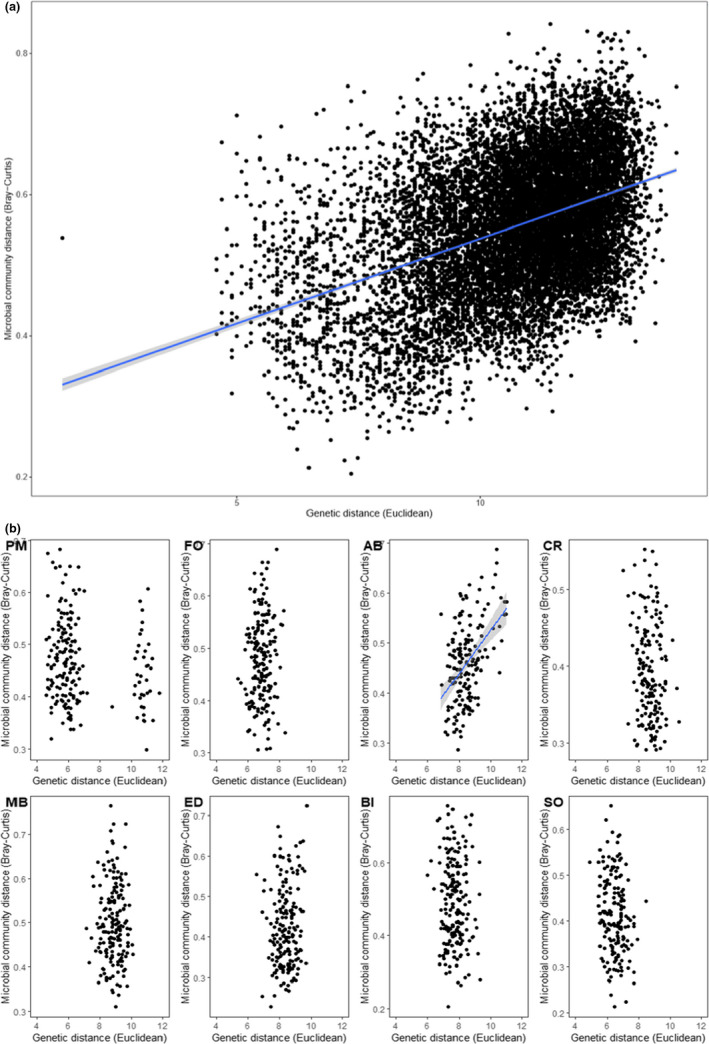
FIGURE 5.

Relationship between microbial community dissimilarity (Bray–Curtis on square‐root‐transformed data) based on all ASVs and genetic distance (Euclidean) between all Phyllospora comosa individuals (a) across and within all sites, and (b) within each site. Sites are ordered north to south: PM, Port Macquarie (n = 20); FO, Forster (n = 20); AB, Anna Bay (n = 19), CR, Cronulla (n = 19); MB, Malua Bay (n = 19); ED, Eden (n = 20); BI, Bicheno (n = 20); SO, Southport (n = 19). Data with significant associations detected using partial Mantel tests were fitted with linear regression. 95% Confidence intervals are shaded in grey
