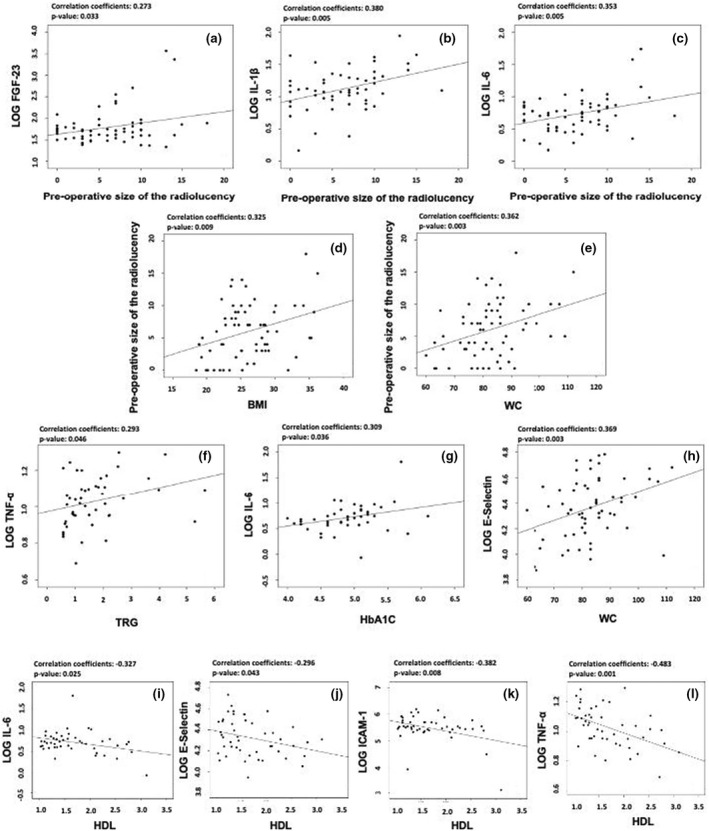
FIGURE 2.

Correlation plots; (a, b, c) correlations between the preoperative size of the lesion with levels of FGF‐23, IL‐1β and IL‐6; (d, e) correlations between BMI and waist circumference with the preoperative size of the lesion; (f) correlation between 1 Yr triglycerides levels with levels of TNF‐α; (g) correlation between 1 Yr HbA1c levels with levels of IL‐6; (h) correlation between waist circumference with E‐selectin levels; (i, j, k, l) correlation between 1 Yr HDL levels with levels of IL‐6, E‐selectin, ICAM‐1 and TNF‐α.
