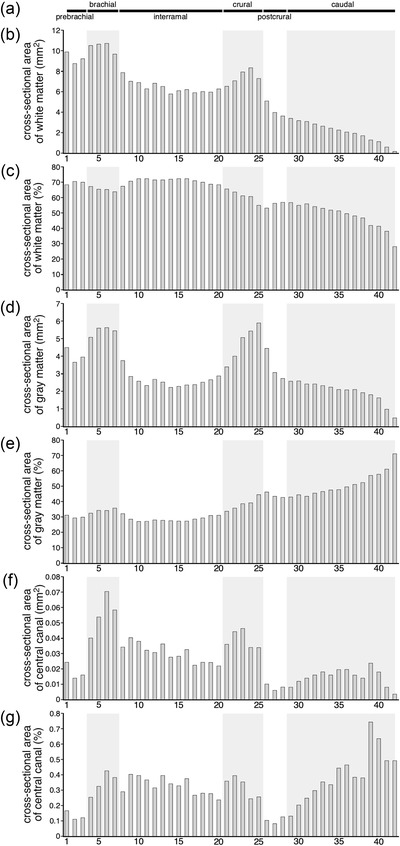
FIGURE 3.

Graphs showing the absolute (b, d, f, data given in mm2) and proportional (c, e, g, data given as a percentage) areas occupied by white matter (b, c), gray matter (d, e), and the central canal (f, g) at the different levels of the tree pangolin spinal cord examined in the current study (Table 2). The six regions into which the spinal cord can be divided are shown at the top of the graphs (a) and are represented by alternating white and pale gray shading in the graphs (b–g). Note than in the brachial and crural regions, the absolute size of the area of the white matter (b), gray matter (d), and central canal (g), increases. In contrast, when represented as a proportion of the total cross‐sectional area of the spinal cord, the relative area occupied by white matter decreased slightly (c), for gray matter there are slightly increases (e), while that of the central canal varies (g)
