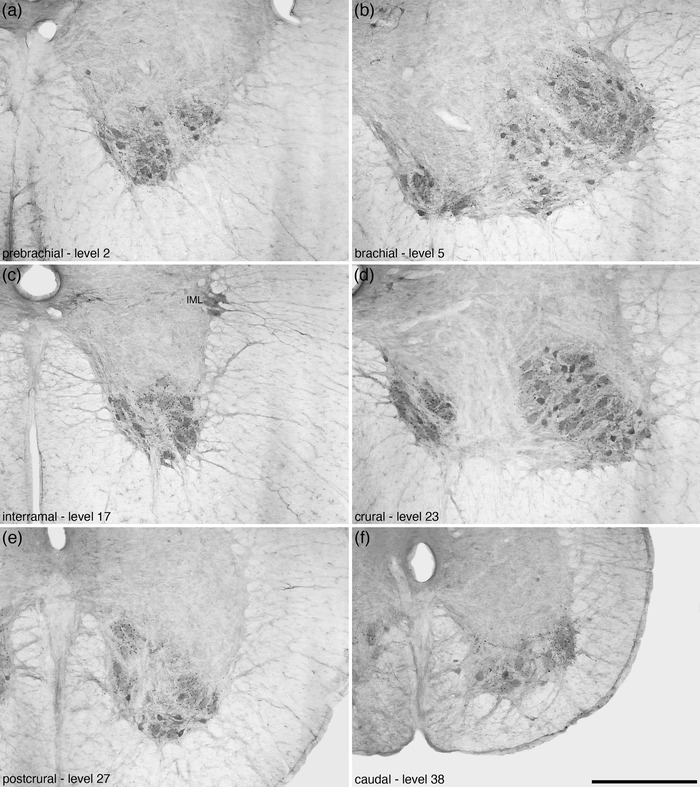
FIGURE 12.

Photomicrographs of coronal sections through the ventral horn of the tree pangolin spinal cord stained for choline acetyltransferase (ChAT) showing the variation in the appearance of lamina 9 of the spinal gray (9Sp) in the different regions of the spinal cord, from rostral (a) to caudal (f). In each image, the region is labeled, as well as the level corresponding to that depicted in Figures 2 and 3. Note that the distinction of these large motoneuron clusters is most apparent in the brachial (b) and crural (d) regions, which correspond to the regions where output to the limbs originates. In all images, dorsal is to the top and medial is to the left. Scale bar in (f) = 500 μm and applies to all images
