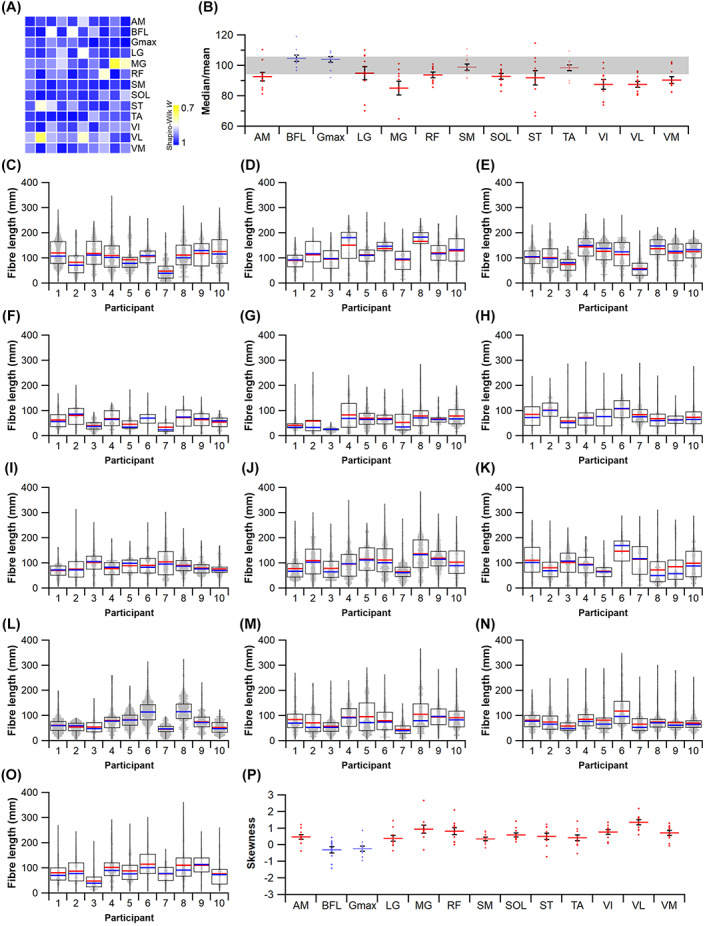
Fig. 9.

Statistical appropriateness of the use of mean fibre length. (A) Every muscle tested in this study violated the Shapiro–Wilk test for normality, indicating that no distribution of sampled fibres was normally distributed, despite a wide range of W statistics for these samples. (B) Dividing the median fibre length by the mean highlights the gross overestimation of fibre lengths when the mean is used, with data points falling outside the grey bar indicating ±5% difference from the mean. (C–O) Distributions of fibre lengths for all 10 participants across the adductor magnus (C), biceps femoris (long head) (D), gluteus maximus (E), lateral gastrocnemius (F), medial gastrocnemius (G) rectus femoris (H), semimembranosus (I), soleus (J), semitendinosus (K), tibialis anterior (L), vastus intermedius (M), vastus lateralis (N) and vastus medialis (O). Mean fibre length (red horizontal line) and median fibre length (blue horizontal line) are presented for each boxplot. (P) Skewness for each individual across each muscle. AM, adductor magnus; BFL, biceps femoris (long head); Gmax, gluteus maximus; LG, lateral gastrocnemius; MG, medial gastrocnemius; RF, rectus femoris; SM, semimembranosus; ST, semitendinosus; SOL, soleus; TA, tibialis anterior; VI, vastus intermedius; VL, vastus lateralis; VM, vastus medialis.
