
Fig. 1.
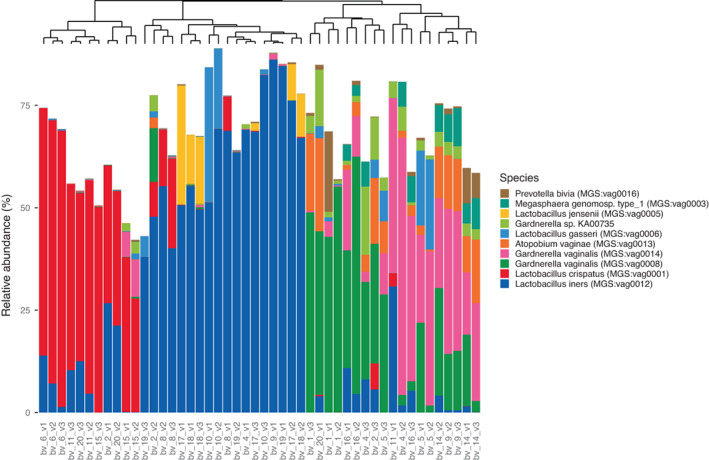
MGS abundance profiles of the top‐10 most dominant MGSs in the study vaginal samples. The samples are clustered based on Bray–Curtis dissimilarity and a phylogenetic tree on top of the plot exhibits the different species clusters. Bars do not sum to 100% because we represent only the 10 most dominant species across samples, and because some reads mapped to non‐MGS‐annotated genes.