Figure 3.

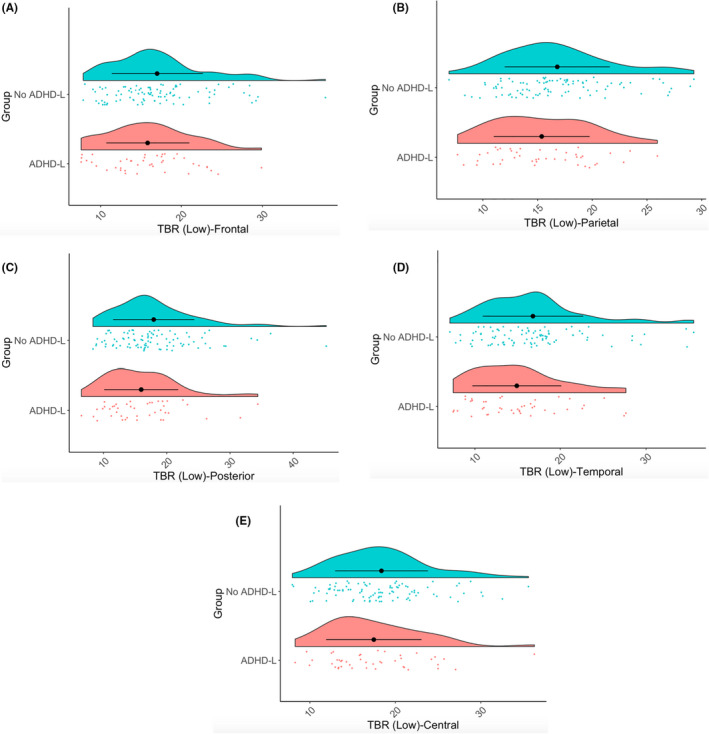
Raincloud plots showing TBR‐Low over frontal (Panel A), parietal (Panel B), posterior (Panel C), temporal (Panel D) and central (Panel E) regions for ADHD‐L and No ADHD‐L participants

Raincloud plots showing TBR‐Low over frontal (Panel A), parietal (Panel B), posterior (Panel C), temporal (Panel D) and central (Panel E) regions for ADHD‐L and No ADHD‐L participants