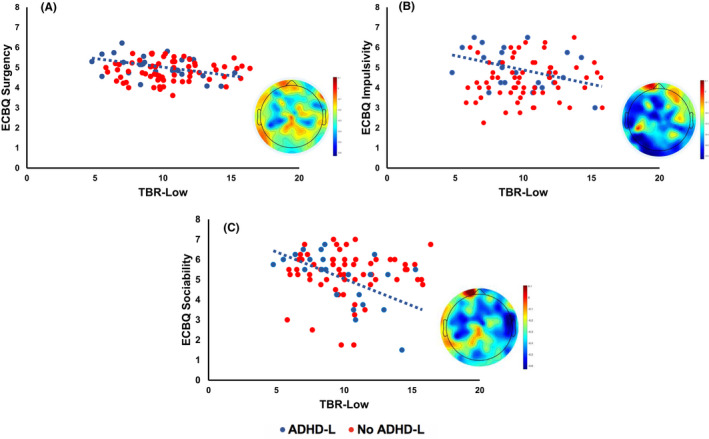
Figure 4.

Scatter graphs showing TBR‐Low over the whole head and ECBQ Surgency (Panel A), Impulsivity (Panel B) and Sociability (Panel C) scores in the ADHD‐L group (blue). The No ADHD‐L group is shown in red for comparison. Topographic plots depict the correlation between TBR‐Low and ECBQ scores for the ADHD‐L group
