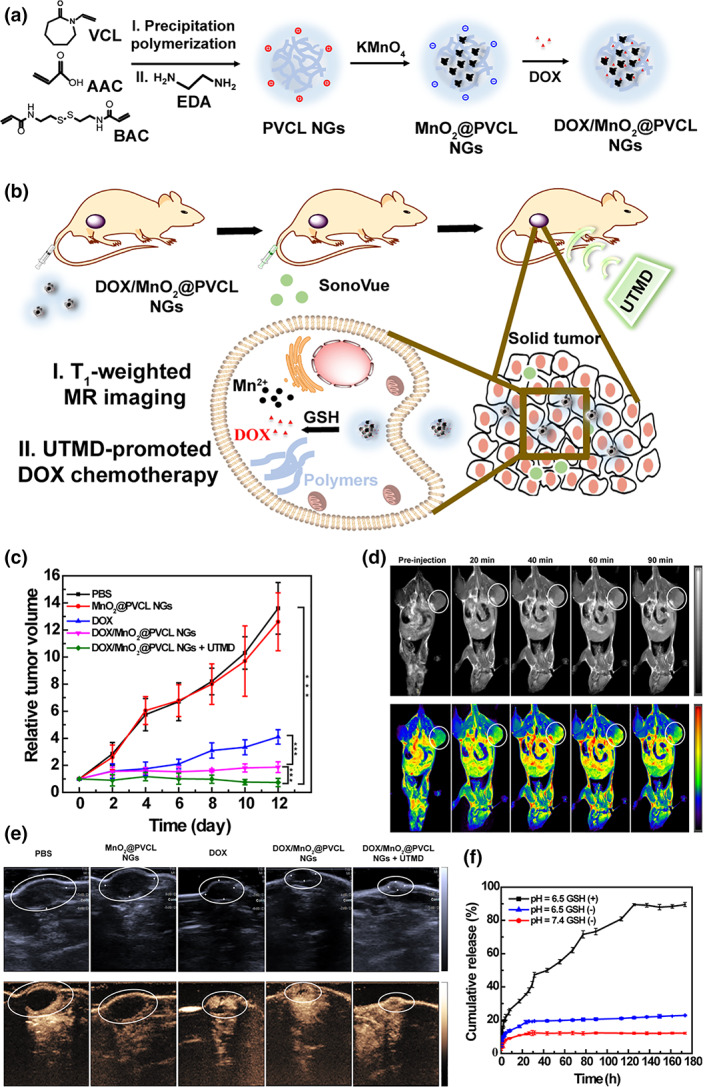
FIGURE 11.

(a) Synthetic route of DOX/MnO2@PVCL NGs. (b) Schematic illustration of DOX/MnO2@PVCL NGs for UTMD‐promoted DOX chemotherapy and MRI. (c) DOX release profile from DOX/MnO2@PVCL NGs at pH 7.4 and 6.5 in the presence or absence of GSH (10 mM). (d) In vivo T1‐weighted MR imaging of subcutaneous B16 tumor‐bearing mice at different time points after the injection of DOX/MnO2@PVCL NGs. (e) B‐mode US images (upper) and CEUS imaging (below) of the tumor on day 12 after different treatments. (f) Relative tumor growth curve after different treatments. Reprinted with permission from Xu, Zhu, et al. (2020). Copyright 2020. Ivyspring International Publisher
