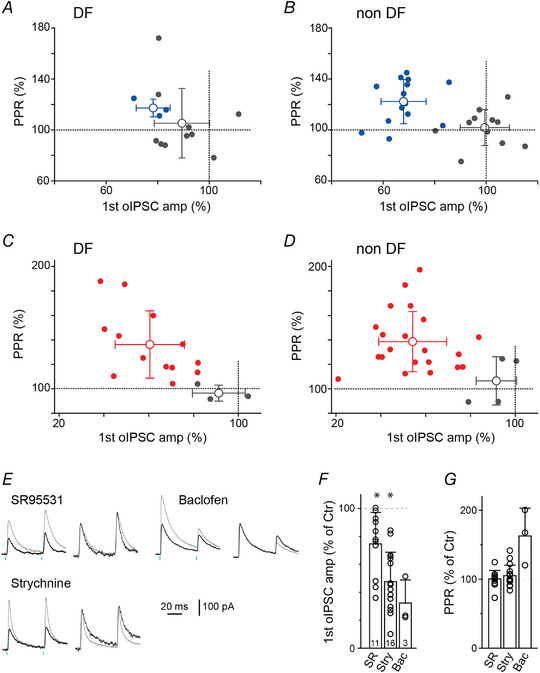
Figure 7. Correlation of opioid effects on amplitude and PPR.

Graphs highlighting the relationship between the percentage oIPSC amplitude change in the presence of a μ‐ (blue; A and B) or κ‐ (red; C, and D) opioid receptor agonists and its relationship to the percentage change in PPR measured from DF (A and C) or non‐DF (B and D) neurons. Dotted lines at 100% indicates the point where the oIPSC amplitude or PPR was unaltered by the opioid agonist. Coloured and grey dots are neurons where an opioid agonist stimulated inhibition of oIPSC amplitude was detected and not detected, respectively (see Methods). Open circles and bars indicate means ± SD. E, pairs of oIPSCs recorded in control solution (grey) or following superfusion with agonists for GABAA, glycine or an antagonist for GABAB‐receptors (SR95531, strychnine and 10 μM baclofen, respectively; black). Right: oIPSCs normalised to the peak of the 1st oIPSC. F and G, quantification of drug effects on the oIPSC peak current (F) and PPR (G). Individual data points (open circles) and the total number of cells treated with drugs are indicated. Data represent means ± SD. Wilcoxon signed‐rank test was used to compare between pre‐ and post‐drug responses. [Colour figure can be viewed at wileyonlinelibrary.com]
