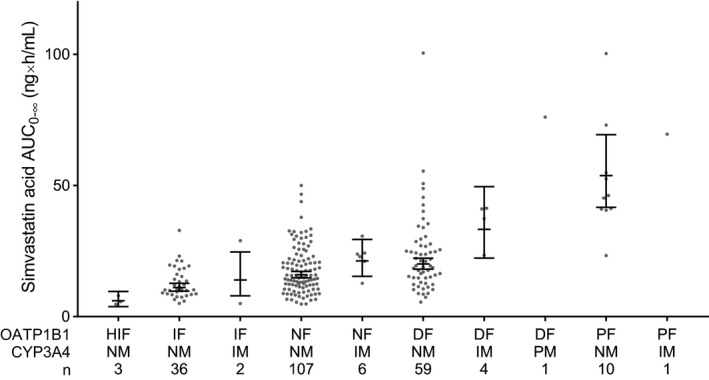
Figure 2.

Area under the plasma simvastatin acid concentration‐time curve from 0 hours to infinity (AUC0–∞) values grouped by genotype predicted organic anion transporting polypeptide 1B1 (OATP1B1) and cytochrome P‐450 3A4 (CYP3A4) phenotypes. Horizontal lines indicate estimated marginal means, whiskers indicate 90% confidence intervals, and gray dots indicate individual AUC0–∞ values. DF, decreased function; HIF, highly increased function; IF, increased function; IM, intermediate metabolizer; NF, normal function; NM, normal metabolizer; PF, poor function; PM, poor metabolizer.
