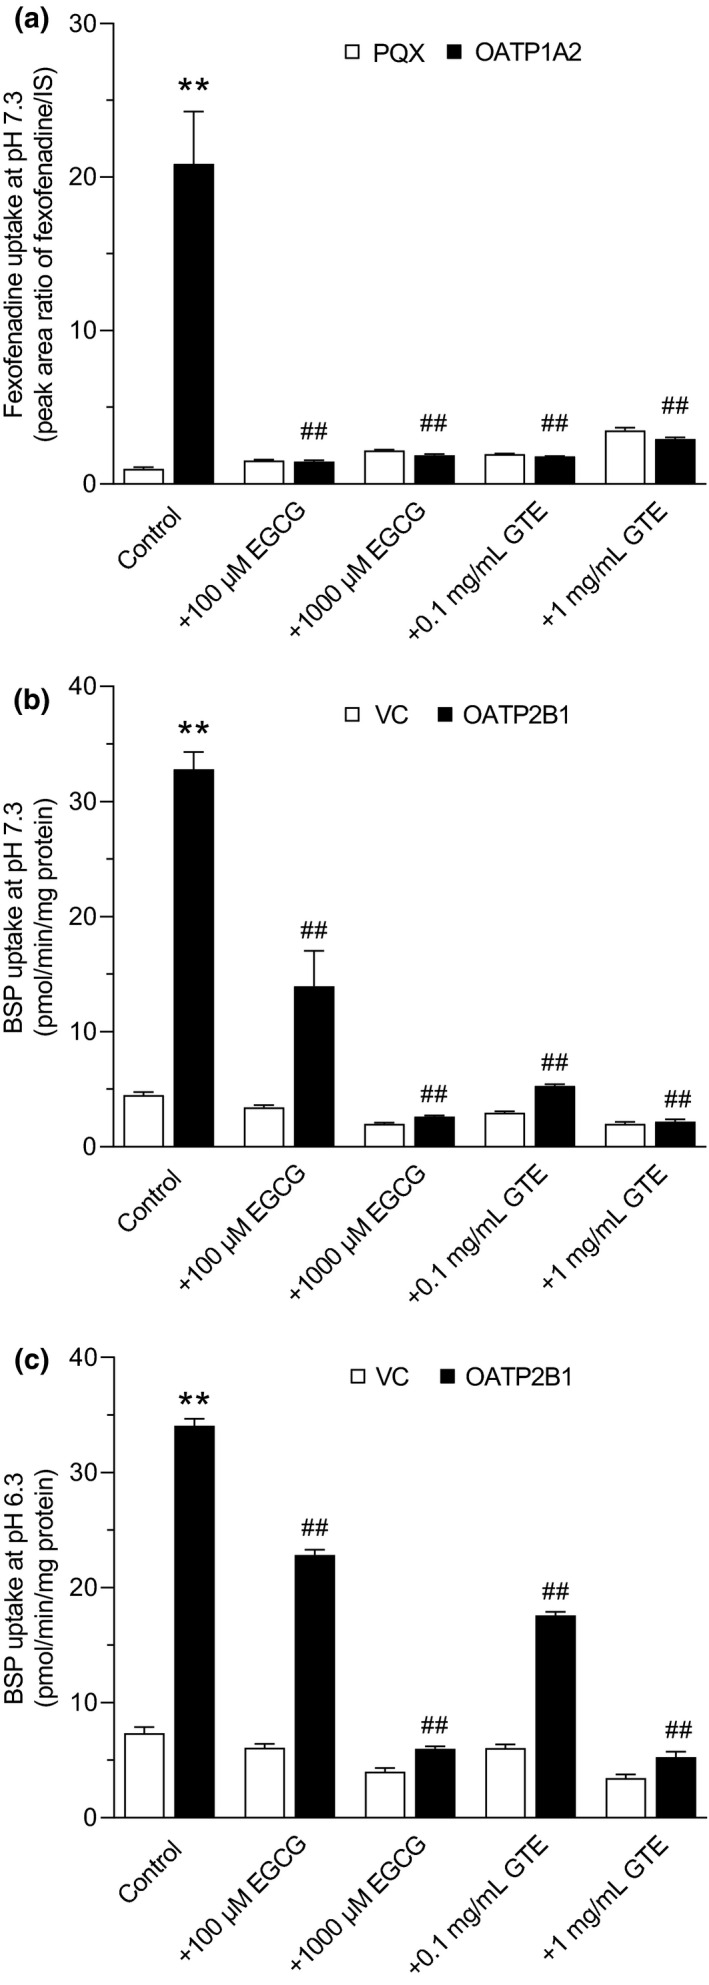
Figure 5.

In vitro uptake assays of fexofenadine in HEK‐OATP1A2 cells or sulfobromophthalein (BSP) in HEK‐OATP2B1 cells (black bars), and in the respective HEK control cells (PQX) for OATP1A2 or (VC) for OATP2B1 (white bars). Cellular accumulation of 10 μM fexofenadine at pH 7.3 (a), or 1 μM BSP at pH 7.3 (b) and pH 6.3 (c) after 10 minutes incubation was measured by liquid chromatography–tandem mass spectrometry (LC–MS/MS) (fexofenadine) or liquid scintillation counting (BSP) in the presence or absence of (−)‐epigallocatechin gallate (EGCG at 100 and 1,000 μM) or EGCG‐concentrated green tea extract (GTE at 0.1 and 1 mg/mL) used in the clinical study. Data are presented as mean ± SEM. (n = 6). **P < 0.01, vs. uptake into HEK293 control cells (PQX or VC); ## P < 0.01, vs. uptake into HEK293‐OATP1A2 or HEK‐OATP2B1 cells without inhibitors.
