
Figure 2.
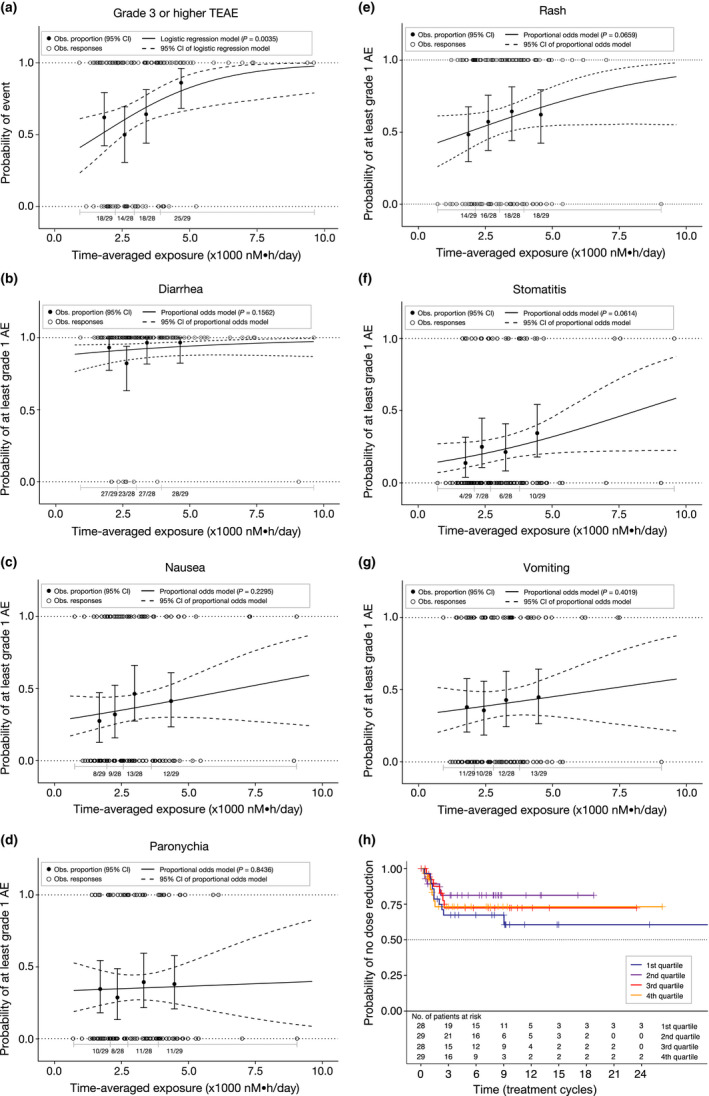
Exposure–safety analyses. Observed (Obs.) and model‐predicted proportions of patients with (a) grade ≥ 3 treatment‐emergent adverse events (TEAEs) and grade ≥ 1 TEAEs of (b) diarrhea, (c) nausea, (d) paronychia, (e) rash, (f) stomatitis, and (g) vomiting. Solid (dashed) curves show model‐predicted probability of the event (95% confidence interval [CI]). Closed circles (error bars) show observed proportion of patients with the TEAE (95% CI based on the Pearson–Klopper method) by exposure quartile. Open circles indicate data from individual patients. n/N is the number of patients with an event/total number of patients in each exposure quartile. P value represents the no exposure effect on the probability of the adverse event (AE). (h) Kaplan–Meier estimates of the time to first mobocertinib dose reduction after cycle 1 day 1 stratified by time‐averaged molar sum exposure quartiles.