
Figure 1.
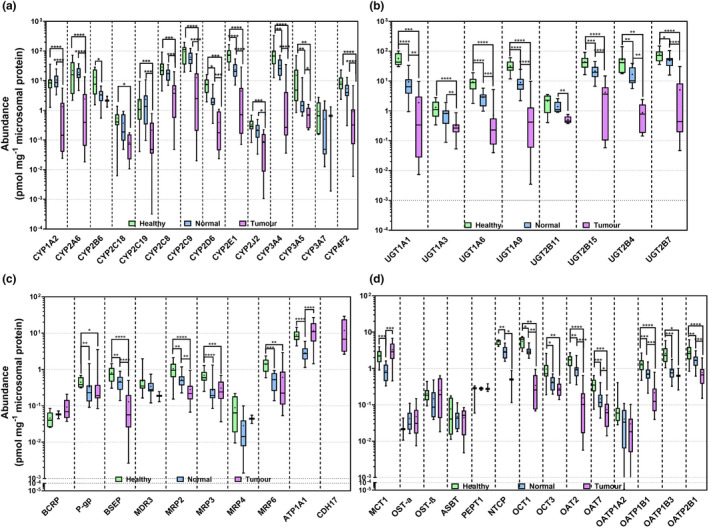
Absolute abundance of cytochrome P450 enzymes (CYPs) (a), UDP‐glucuronosyltransferases (UGTs) (b), ATP‐binding cassette (ABC) transporters, ATPase subunit alpha‐1 (Na+/K+‐ATPase; ATP1A1) and cadherin‐17 (CDH17) (c), and solute carriers (SLCs) (d) in HLM from healthy (n = 15), histologically normal (n = 18) and tumorous (n = 18) tissues. Abundances are represented as box and whiskers plots with the whiskers reflecting the minimum and maximum values, the boxes showing the 25th and 75th percentiles, the lines showing the medians, and the + signs showing the means. Mann‐Whitney test was used to assess differences between healthy and histologically normal, between healthy and tumorous livers and between histologically normal and tumorous livers for each enzyme. *P < 0.05, **P < 0.01, ***P < 0.001, and ****P < 0.0001.