Figure 5.

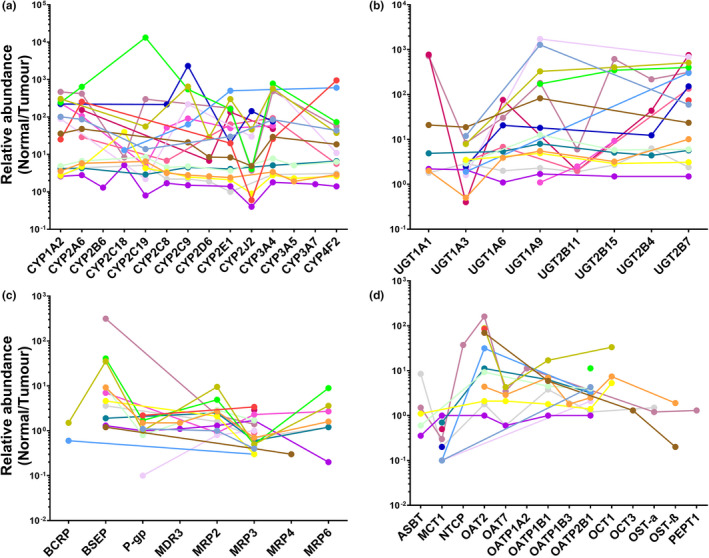
Relative abundance of CYPs (a), UGTs (b), ABC transporters (c), and SLCs (d) in individual HLMs from histologically normal tissue compared to matched tumors (n = 18).

Relative abundance of CYPs (a), UGTs (b), ABC transporters (c), and SLCs (d) in individual HLMs from histologically normal tissue compared to matched tumors (n = 18).