
Figure 7.
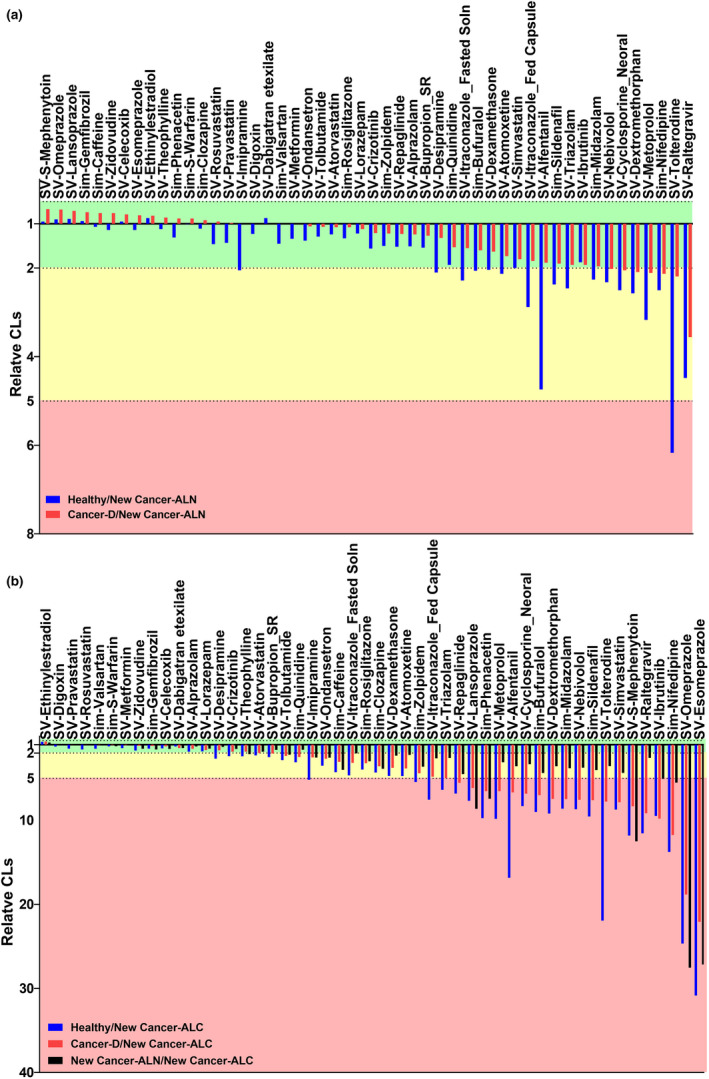
Relative CL of drugs in healthy (blue), and cancer‐D (red) to new cancer‐ALN (a) or new cancer‐ALC (b) populations, and new cancer‐ALN (white) to new cancer‐ALC (b) populations. Healthy: default abundances of enzymes and transporters (Simcyp) with a healthy population. Cancer‐D: default abundances of enzymes and transporters (Simcyp) with a cancer population. New Cancer‐ALN: abundance of enzymes and transporters measured in this study for histologically normal tissue with a cancer population. New Cancer‐ALC: abundances of enzymes and transporters measured in this study for cancer tissue with a cancer population. The green rectangle shows the drugs with less than 2‐fold change in drug clearance (CL) than that obtained using the new cancer‐ALC model, the amber shows 2 to 5‐fold higher CL than that obtained using the new cancer‐ALC model, and the red shows more than 5‐fold higher CL than that obtained using the new cancer‐ALC model.