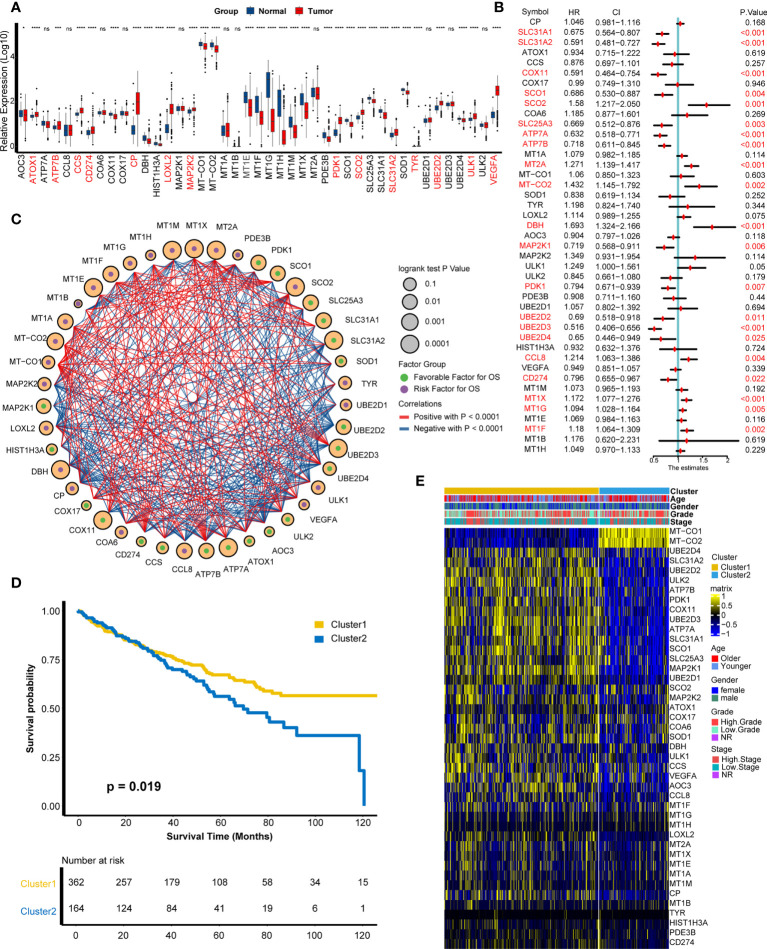
Figure 1.
Development of cuproptosis-related patterns. (A) Expression of cuproptosis-related genes in tumors and adjacent normal tissues. (B) Prognostic analysis of cuproptosis-related genes using univariate Cox regression. (C) Correlation analysis among cuproptosis-related genes. The size of the circle represented the p-value of overall survival, the green and purple dots in the circle meant favorable and risk factor in prognosis, and the red and blue lines that connected two circles meant positive and negative regulating relationships, respectively. (D) Survival outcome between two patterns. (E) Distribution of clinical features (age, gender, grade, and stage) and expression matrix of cuproptosis-related patterns. *p < 0.05, ***p < 0.001, ****p < 0.0001; ns, not statistically significant.

