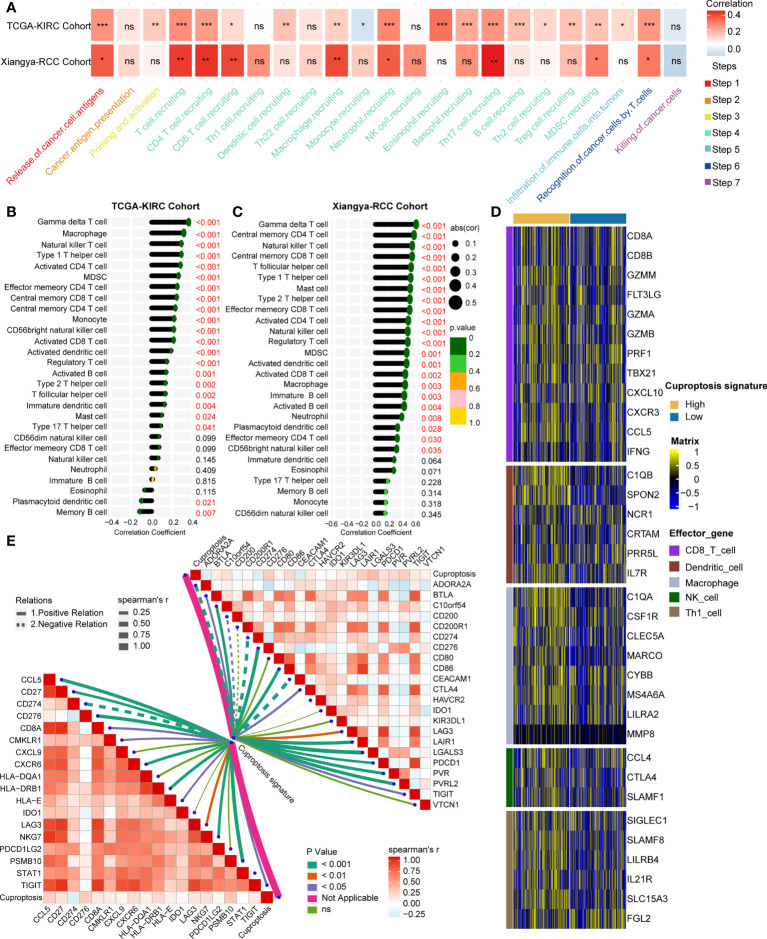
Figure 4.
Estimated infiltration level of tumor-infiltrating leukocytes (TILs) and efficacy of immune checkpoint blockade on individuals by cuproptosis signature. (A) Correlation analysis on cuproptosis signature and cancer immunity steps in the TCGA-KIRC and Xiangya-RCC cohorts. *p < 0.05, **p < 0.01, ***p < 0.001; ns, not statistically significant. (B, C) Correlation analysis on cuproptosis signature and TILs in the TCGA-KIRC and Xiangya-RCC cohorts. (D) Expression matrix of TILs (CD8+T cell, dendritic cell, macrophage cell, NK cell, and Th1 cell in the high- and low-score signature groups. (E) Correlation analysis on cuproptosis signature and T cell inflamed score (left) and inhibitory immune checkpoints (right). The solid and dotted lines represent positive and negative connections, respectively; the thickness of the lines represents the coefficient of the relations; and the diverse colors of the lines represent the p-values of the relations.

