Figure 3.
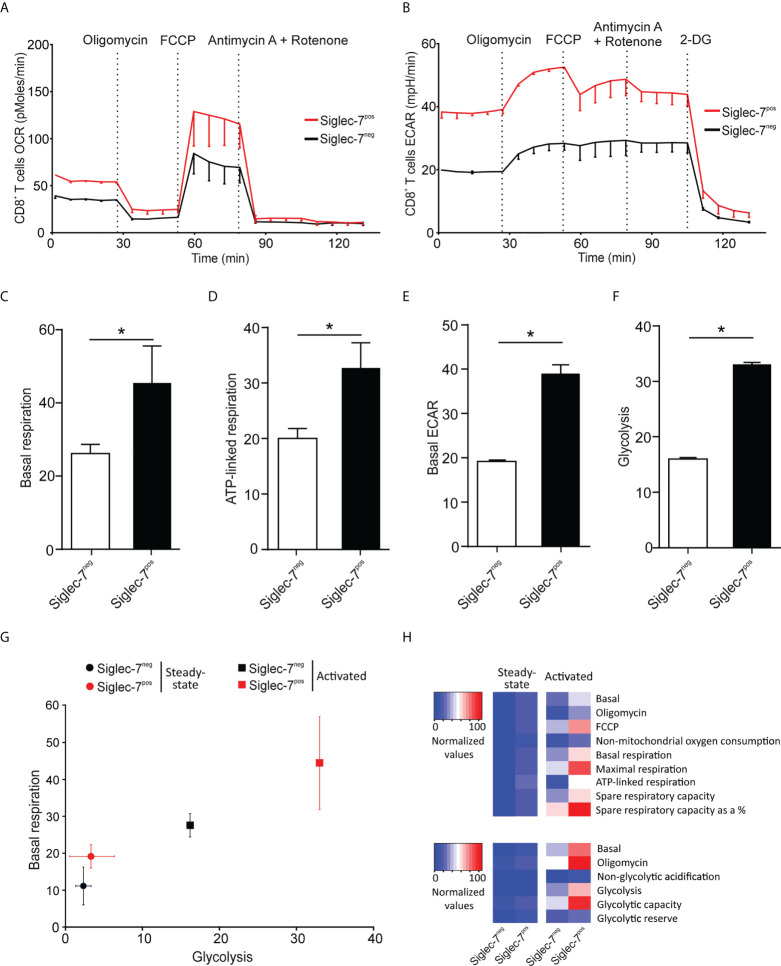
Upon activation Siglec-7+ CD8+ T cells exhibit a higher increase in oxidative phosphorylation and glycolysis compared to Siglec-7- CD8+ T cells. Seahorse analysis of Siglec-7+ or Siglec-7- CD8+ T cells after 7 days of co-stimulation by αCD3 and αCD28 (each at 1 μg/mL) (three independent experiments with 2-4 donors each, 11 donors in total). Oxygen consumption rate (OCR) (A) and extracellular acidification rate (ECAR) (B) profiles, basal respiration (steady state mitochondrial respiration) (C), and ATP-linked respiration (ΔOCR after oligomycin injection) (D), basal acidification (ECAR at steady state) (E), and glycolysis (ΔECAR at steady state minus non-glycolytic acidification in response to 2-DG injection) (F). (G, H) Comparison of the metabolic profiles of αCD3 and αCD28 co-stimulated and unstimulated Siglec-7+ and Siglec-7- CD8+ T cells. Plot representation of basal respiration and glycolysis rates (G) and heatmap representation (H). Statistical analyses were performed by paired t test (C–F). *P < 0.05. Error bars, SEM (A, B) or SD (C–G).

