Figure 6.
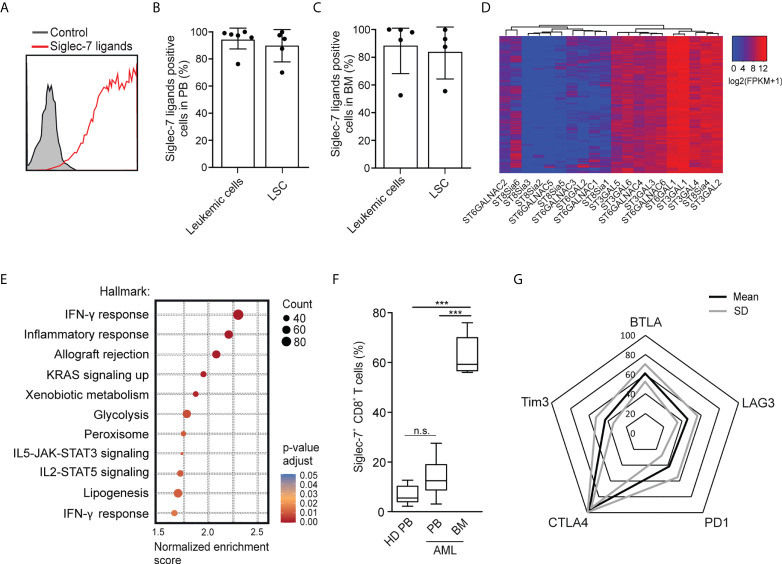
Occurrence of Siglec-7+ CD8+ T cells glyco-immune checkpoints in AML. (A) Representative flow cytometric histogram demonstrating Siglec-7 ligands surface expression on AML cells isolated from bone marrow (BM). (B–C) Siglec-7 ligands expression on AML patient peripheral blood leukemic cells (n=6) and leukemic stem cells (LSC; n=5) (B), or bone marrow leukemic cells (n=5) and leukemic stem cell (LSC; n=4) (C). (D) RNA expression of sialyltransferases in AML patients based on TCGA Network data computed by a dendrogram clustering algorithm and (E) gene set enrichment analysis performed using hallmark gene sets (n=818). (F) Quantitative analysis of Siglec-7 expression by CD8+ T cells from the PB (PB, n=8) and from the bone marrow (BM, n=5) of patients with acute myeloid leukemia (AML). (G) Radar chart of flow-cytometric data demonstrating surface coexpression of Siglec-7 with PD1, CTLA4, BTLA, LAG3, or TIM3 on CD8+ T cells from AML bone marrow (n=4). Statistical analyses were performed by one-way ANOVA followed by Bonferroni posttest (F) ***P < 0.001; n.s., not significant. Error bars, SD.

