
Figure 3.
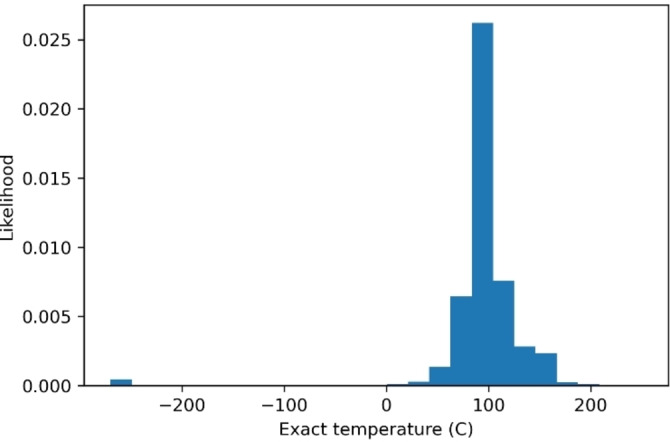
Distribution of temperatures in the dataset. The likelihood is taken as the frequency divided by the total number of data points. There are clearly some incorrect data points with recorded temperatures below −200 degrees Celsius.
Official websites use .gov
A
.gov website belongs to an official
government organization in the United States.
Secure .gov websites use HTTPS
A lock (
) or https:// means you've safely
connected to the .gov website. Share sensitive
information only on official, secure websites.
Distribution of temperatures in the dataset. The likelihood is taken as the frequency divided by the total number of data points. There are clearly some incorrect data points with recorded temperatures below −200 degrees Celsius.