
FIGURE 4.
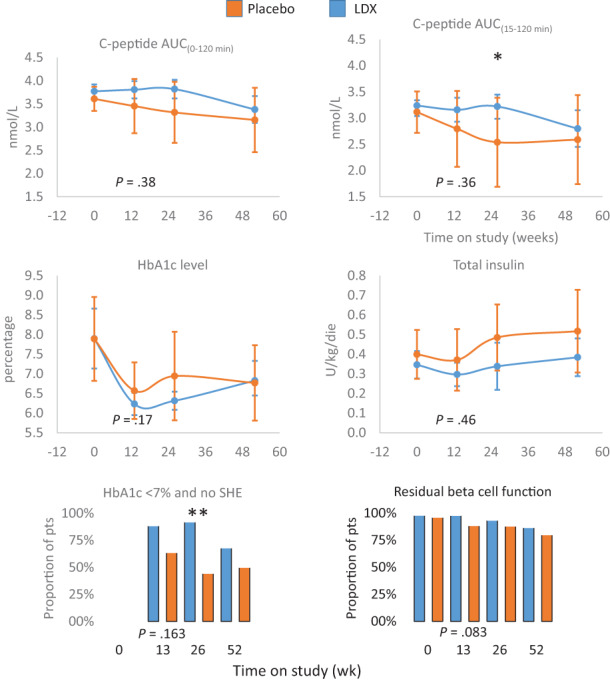
Primary and secondary outcomes in the predefined subgroup with fasting C‐peptide (pre‐MMTT) of less than 0.205 nmol/L (median value). The effects of ladarixin (LDX) on the 2‐hour area under the curve (AUC) of C‐peptide AUC(0‐120 min), C‐peptide AUC(15‐120 min) above fasting value, HbA1c level, insulin dose, proportion of patients with HbA1c less than 7% and absence of episodes of severe hypoglycaemia (SHE) and proportion of patients maintaining a residual beta cell function (defined as at least one MMTT C‐peptide value >0.2 nmol/L). Means (95% CI) or proportions for each treatment group are reported over time. The analysis of covariance model adjusted for age, sex, baseline value and treatment assignment or Fisher′s exact test for categorical independent variables were used to compare the two groups. All P values referring to week 13 are reported in full. MMTT, mixed meal tolerance test. * P < .05, ** P < .001