
FIGURE 4.
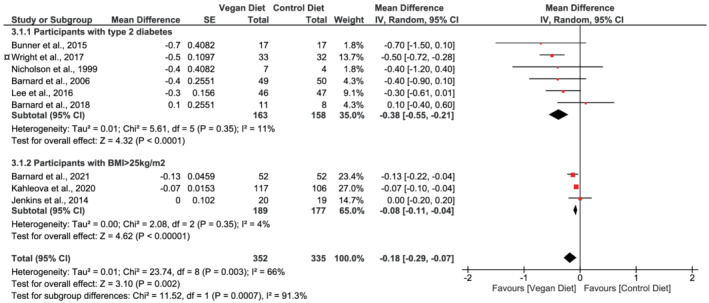
Forest plot depicting the effect of vegan diets on glycated hemoglobin (%) (HbA1c). Plots depict the effect size (mean difference) and 95% confidence interval for the individual studies and the pooled estimate overall and by subgroups. Studies are ordered by effect size. BMI, body mass index; CI, confidence interval; IV, inverse variance; SE, standard error. ¤The study by Wright and colleagues was placed in the subgroup “Participants with type 2 diabetes.” Participants were either obese (BMI ≥ 30 kg/m2) or overweight (BMI ≥ 25 kg/m2) with either a diagnosis of type 2 diabetes or ischemic heart disease or had hypertension or hypercholesterolemia