
FIGURE 6.
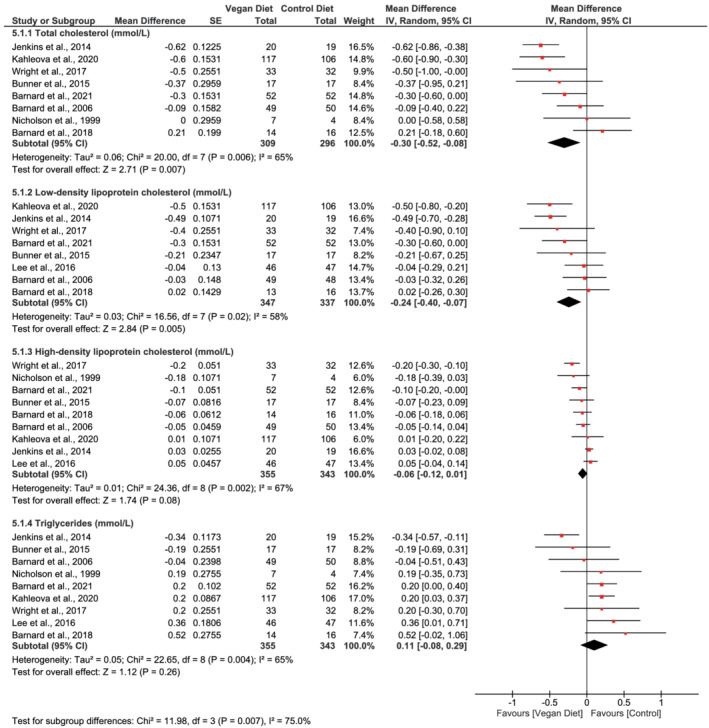
Forest plot depicting the effect of vegan diets on blood lipids (total cholesterol, low‐density lipoprotein cholesterol, high‐density lipoprotein cholesterol, and triglycerides) (mmol/L). Plots depict the effect size (mean difference) and 95% confidence interval for the individual studies and the pooled estimate overall and by subgroups. Studies are ordered by effect size. CI, confidence interval; IV, inverse variance; SE, standard error