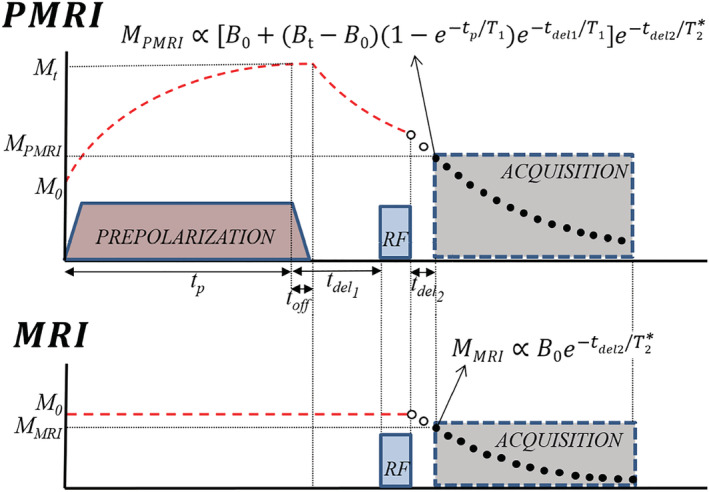
FIGURE 1.

PMRI (top) and MRI (bottom) pulse sequences used in this work, with analytical expressions for the magnetization at the start of FID acquisition. Their ratio represents the SNR gain due to prepolarization, as per Equation (2). and are the magnetizations in thermal equilibrium with and without prepolarization and are directly proportional to and respectively. Red dashed lines represent the longitudinal magnetization. Black points represent k‐space data measured during the acquisition, while white points are not measured and lead to a gap in space
