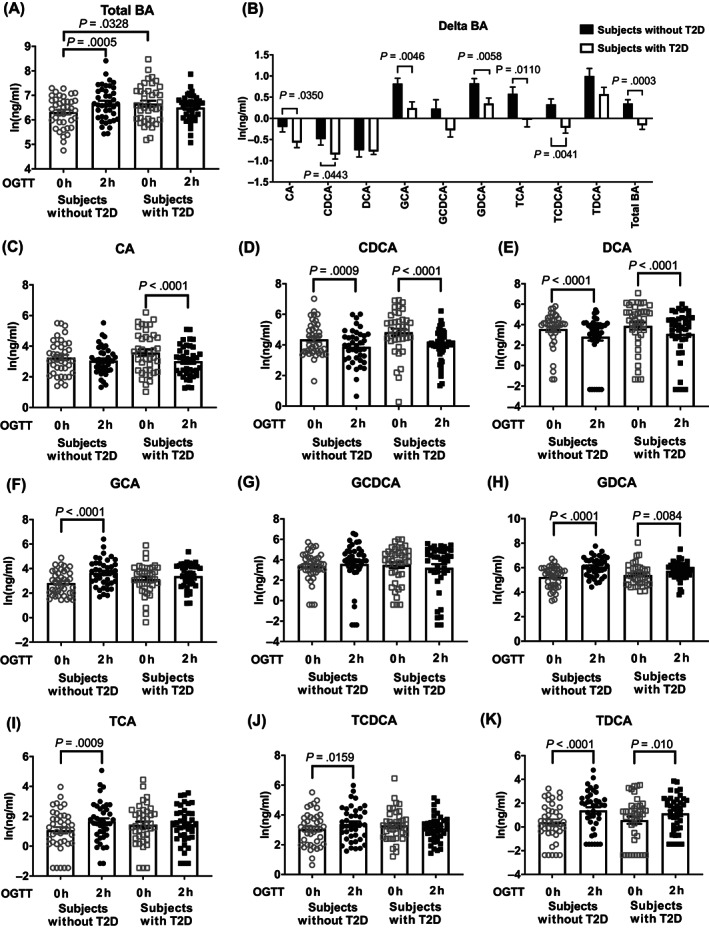
FIGURE 1.

The ln‐transformed serum concentrations of total bile acid (BA) (A), cholic acid (CA), chenodeoxycholic acid (CDCA), deoxycholic acid (DCA), glycocholic acid (GCA), glycochenodeoxycholic acid (GCDCA), glycodeoxycholic acid (GDCA), taurocholic acid (TCA), taurochenodeoxycholic acid (TCDCA), and taurodeoxycholic acid (TDCA) before and 2 hours after 75‐g oral glucose (C–K), as well as their respective changes following oral glucose (B) (n = 40 for each group). Paired or unpaired t test was used for comparison between the two groups. OGTT, oral glucose tolerance test; T2D, type 2 diabetes
