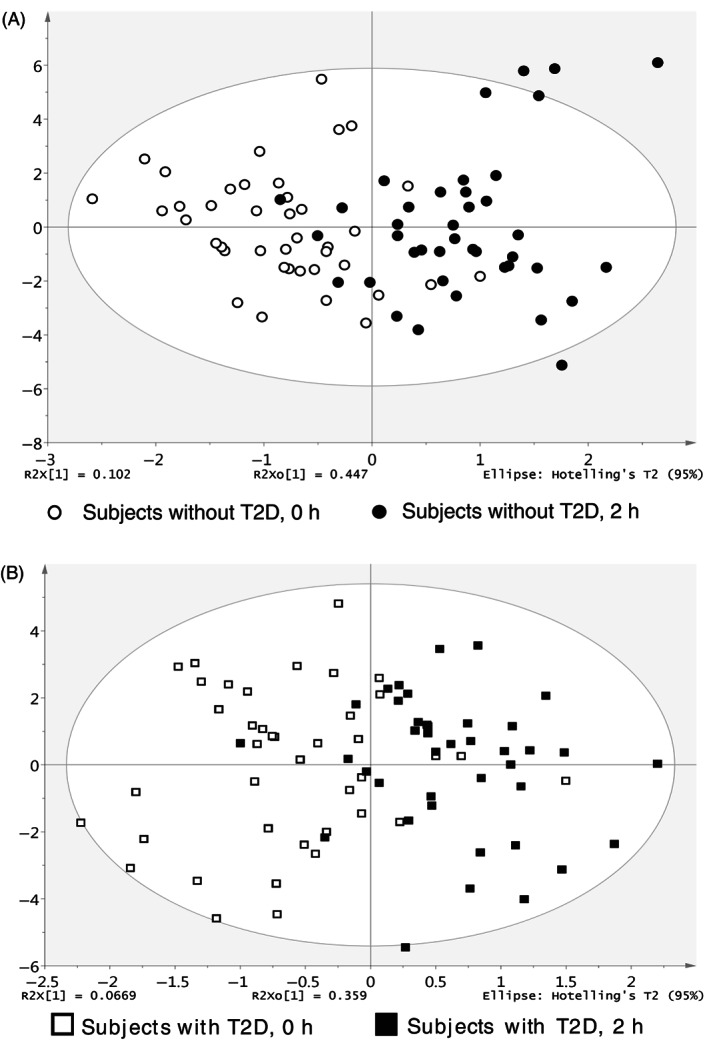
FIGURE 2.

Score scatterplots of orthogonal partial least squares discriminant analysis (OPLS‐DA) of the bile acid (BA) profiles before and 2 hours after oral glucose in subjects without type 2 diabetes (T2D) (A) and with T2D (B) (n = 40 per group). The separations in the score scatterplots in panels A and B reflected the changes in the BA profiles after oral glucose in both subject groups
