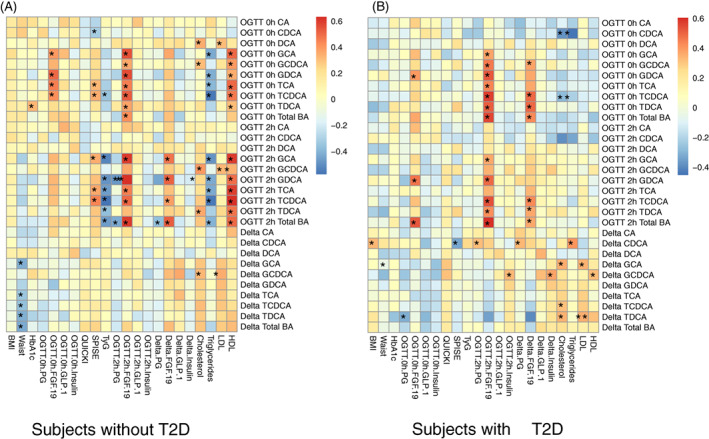
FIGURE 3.

Heatmaps showing Pearson correlations between bile acids (BAs) and demographic and biochemical variables in subjects without type 2 diabetes (T2D) (A) and with T2D (n = 40 per group). Blue colour indicates negative r values, while red colour indicates positive r values. * P < .05 is considered significant correlation. Serum BA levels at baseline and 2 hours in subjects without T2D correlated positively with high‐density lipoproteins (HDL) and negatively with triglycerides, while changes in individual and total BA levels after oral glucose correlated negatively with waist circumference. However, these relationships were less evident in subjects with T2D. In both groups, serum fibroblast growth factor‐19 (FGF‐19) concentrations at 2 hours correlated positively with serum total and conjugated, but not unconjugated, BA levels. By contrast, there were no significant relationships between serum glucagon‐like peptide‐1 (GLP‐1) concentrations and total and individual BA levels at either fasting or 2 hours in either group. There was also a lack of consistent patterns for the relationships between quantitative insulin‐sensitivity check index (QUICKI), or serum insulin, and total or individual BA levels in either group. However, single point insulin sensitivity estimator (SPISE) was related directly to taurocholic acid (TCA) and taurochenodeoxycholic acid (TCDCA) at both fasting and 2 hours in subjects without T2D, but not in those with T2D. Triglycerides‐glucose index (TyG) correlated negatively with five conjugated and total BAs at 2 hours after oral glucose tolerance test (OGTT) in subjects without T2D, but not in those with T2D. The 2‐hour glucose, expressed either as the absolute level or the change from baseline, was related inversely to serum total BA levels at 2 hours in subjects without T2D, but not in those with T2D. BMI, body mass index; LDL, low‐density lipoproteins
