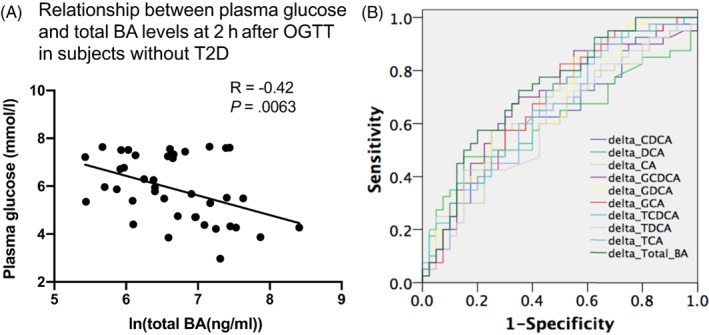
FIGURE 4.

A, Relationship between 2‐hour plasma glucose and serum total bile acid (BA) concentrations in subjects without type 2 diabetes (T2D). B, ROC curves for identification of the healthy and subjects with T2D based on the change of ln BAs from baseline to 2 hours, with area under the curve (AUC) being greatest in the change of ln total BA (AUC = 0.726). CA, cholic acid; CDCA, chenodeoxycholic acid; DCA, deoxycholic acid; GCA, glycocholic acid; GCDCA, glycochenodeoxycholic acid; GDCA, glycodeoxycholic acid; OGTT, oral glucose tolerance test; ROC, receiver operating characteristic; TCA, taurocholic acid; TCDCA, taurochenodeoxycholic acid; TDCA, taurodeoxycholic acid
