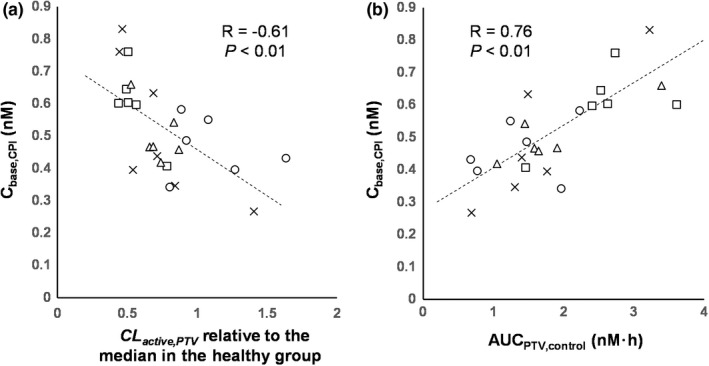
Figure 2.

Correlation between baseline coproporphyrin I (CPI) exposure and pitavastatin PK parameters of healthy participants and participants with chronic kidney disease (CKD). Correlations between mean baseline concentration of CPI (Cbase,CPI) and (a) individuals' CL active,PTV estimated in the final pitavastatin CKD model (expressed as relative values to median of those in the healthy group) or (b) pitavastatin AUC without rifampin (AUCPTV,control). Marks represent individual participants, and symbols represent CKD groups: healthy (circle), mild CKD (triangle), moderate CKD (square), and severe CKD (cross). Dashed lines represent regression lines. AUC, area under the plasma concentration‐time curve; CL active,PTV , hepatic uptake clearance of pitavastatin; PK, pharmacokinetic.
